Reconstruction Cost Bar Graph – Financial Planning and Budget
RJ0600044_18
- Last Update 07/02/2025
- File Size 6.9MB
- # of Slides 2
- File Format PPTX
- Slide Ratio 16:9
- Color
Keywords
- #Content-Based Slides
- #Design-Based Slides
- #Financial Plans and Performance
- #Graph
- #Capital Requirements
- #Budget
- #Other
- #Other Charts
- #16:9
- #clustered column chart PowerPoint
- #multi-year financial comparison slide
- #bar graph template
- #budget analysis presentation
- #data visualization slide
- #financial performance chart
About the Product
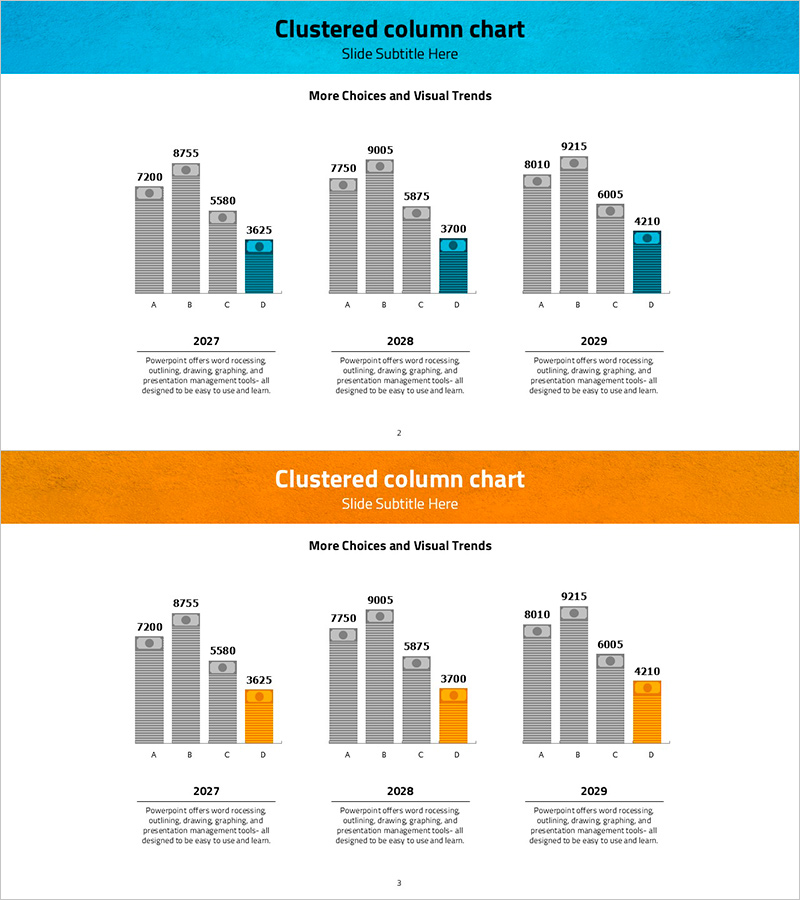
A PowerPoint slide featuring three clustered column charts visualizing annual financial data from 2027 to 2029. Each chart displays four data series (A, B, C, D) with numerical values, using teal and orange accent colors to highlight key metrics. Ideal for financial planning presentations, budget analysis, business performance reports, and multi-year trend comparisons. The 16:9 widescreen format includes two fully editable slides ready for immediate use in executive presentations and stakeholder meetings.
Usage Points
-
Main Usage
Visualize multi-year financial metrics, budget allocations, and business performance across multiple data series using clustered column charts. Simultaneously display year-over-year changes and item-by-item comparisons to communicate trends and relative magnitudes clearly to stakeholders.
-
How to Use
Insert into financial planning presentations, budget review meetings, quarterly performance reports, and business proposals where multi-year data comparison is required. Replace numerical values with actual data, update titles and legends, and customize colors to match corporate branding for immediate deployment.
-
Recommended For
CFOs, finance teams, executives, business planners, consultants, and investment managers who require data-driven decision-making presentations. Particularly effective for budget planning, performance evaluation, and business proposal stages requiring multi-item comparative analysis.
-
Slide Structure
Slide 1: Three clustered column charts with teal accent color (2027, 2028, 2029) / Four data series (A, B, C, D) per year with numerical labels / Descriptive text below each chart. Slide 2: Identical chart structure with orange accent color / Alternative color scheme for visual variation / Full 16:9 widescreen format throughout.
Related Products
-

Global Travel Market Trends – Insights Through Data Visualization
#Financial Plans and Performance #Diagram #Graph
-

Ticket Illustration Table – Visualizing Budget Planning
#Financial Plans and Performance #Diagram #Capital Requirements
-

Modern Graph Slide Template for Data Visualization
#Financial Plans and Performance #Diagram #Graph
-

Item-by-item Budget Diagram – Enhance Efficiency in Financial Planning
#Financial Plans and Performance #Diagram #Capital Requirements
