Two Simple Box Tables – A Practical Presentation Tool
RJ0600042_6
- Last Update 07/02/2025
- File Size 0.4MB
- # of Slides 2
- File Format PPTX
- Slide Ratio 16:9
- Color
Keywords
About the Product
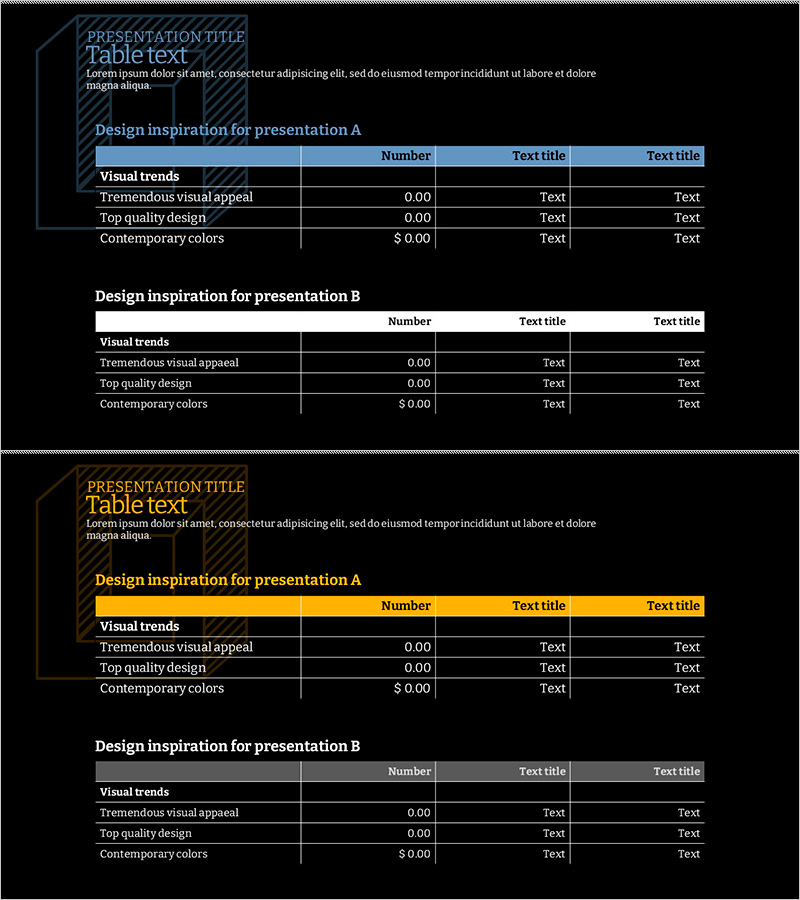
A practical PowerPoint slide template designed for data comparison and information organization. The two-section box table structure enables simultaneous visualization of two items, with each box containing number, text, and title fields for expressing numerical data and descriptions together. The dark background combined with blue header bars and white text provides clear visual contrast, while the 2-slide 16:9 widescreen format offers flexible integration into presentation flows. Immediately editable for business reports, proposals, marketing plans, and other professional documents.
Usage Points
-
Main Usage
Compare or contrast two items, concepts, or products side by side. Enter numbers, text, and descriptions in each box to create visual information hierarchy, helping audiences instantly grasp differences and similarities between the two subjects.
-
How to Use
Double-click text fields to input titles, numbers, and descriptions. Arrange different items in left and right boxes, then adjust colors or font sizes to emphasize key elements. Repeat across multiple slides to maintain consistent comparison structure throughout your presentation.
-
Recommended For
Ideal for business plans, proposals, marketing strategies, product comparisons, and performance reports where two options, approaches, or outcomes need to be contrasted. Suitable for financial analysis, market comparisons, strategy evaluations, and any business presentation requiring quantitative or qualitative data comparison.
-
Slide Structure
Composed of two independent box sections, each containing three input areas: header (title), number field, and text area. Dark background with blue header bars and white text creates clear visual hierarchy, optimized for 16:9 widescreen format with symmetrical left-right layout.
Related Products
-

Marketing Goals Overlay Diagram – Visualized Business Strategy
#Business Vision and Strategy #Marketing Plan and Strategy #Diagram
-

Diagram of Main Business Activities Areas – Visual Representation for Business Introduction
#Company Introduction #Business Introduction #Diagram
-

Newspaper Wide PowerPoint Template Schedule – Business Strategy
#Business Strategy #Operational Plan #Diagram
-

Diagram Slide for Major Awards and Achievements
#Company Introduction #Diagram #Awards and Certifications, and Patents
