Vertical Bar Analysis Graph – Essential Tool for Market and Competitor Analysis
RL0100014_3
- Last Update 01/19/2025
- File Size 2MB
- # of Slides 2
- File Format PPTX
- Slide Ratio 4:3
- Color
Keywords
About the Product
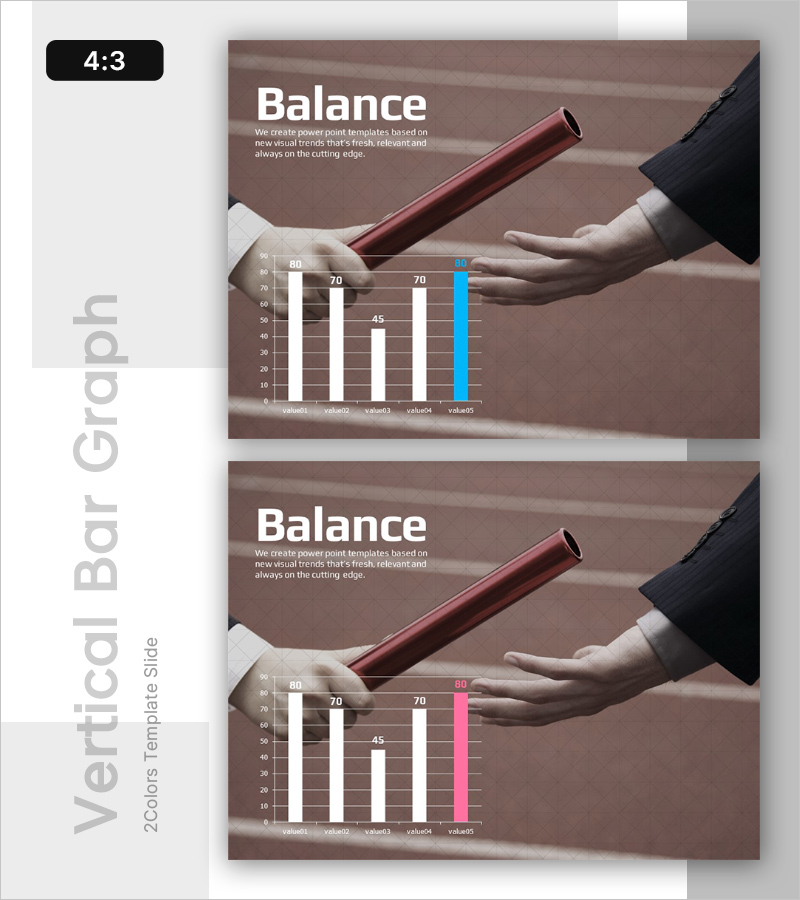
A vertical bar graph PowerPoint slide optimized for market analysis and competitor analysis presentations. Featuring a warm brown background with white and pink accent colors, this slide template offers two color variations to suit different presentation styles. The chart clearly displays five data items with labeled values, making numerical comparisons intuitive and impactful. Each slide includes dedicated title and description text areas alongside the data input fields, enabling quick customization. Provided in 4:3 aspect ratio PPTX format for seamless compatibility with existing presentations, this slide is ready for immediate use in financial reports, marketing plans, and business analysis documents.
Usage Points
-
Main Usage
This slide enables side-by-side comparison of five numerical data points such as market share, competitor performance, sales figures, or customer satisfaction metrics. The warm brown tone provides a professional backdrop while white and pink accents draw attention to key data insights, supporting clear decision-making communication.
-
How to Use
Enter your analysis title and description in the text fields, then update the bar chart values and labels to match your data. Choose between the two color variations based on your presentation's overall tone, and duplicate bars if additional data items are needed.
-
Recommended For
Ideal for marketing strategy presentations, business analysis reports, executive briefings, investor pitch decks, and market research presentations. Particularly valuable for finance, marketing, and strategy teams presenting data-driven insights and competitive positioning.
-
Slide Structure
Each slide contains a title area at the top, a descriptive text section, and a vertical bar chart with five labeled data items and corresponding values. Both slides share identical layouts with only color variations, allowing consistent data presentation across different visual themes.


