Family Bond Analysis Graph
RL0100036_3
- Last Update 01/20/2025
- File Size 5.5MB
- # of Slides 2
- File Format PPTX
- Slide Ratio 4:3
- Color
Keywords
About the Product
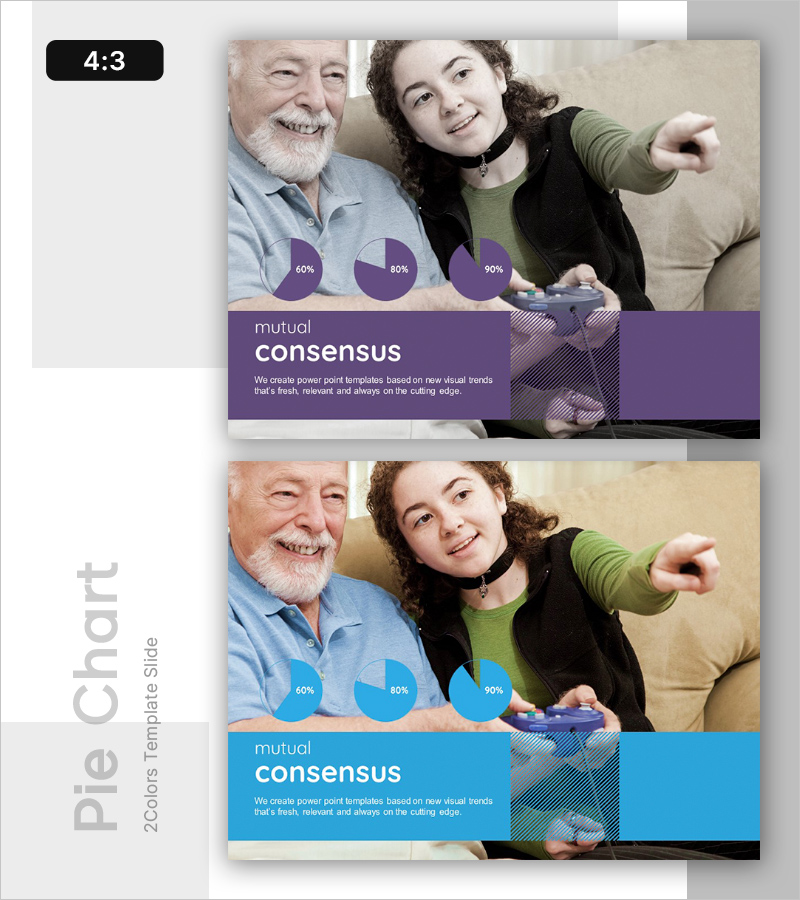
A pie chart PowerPoint slide that quantifies family communication and relationship strength across three metrics (60%, 80%, 90%). The purple-toned design features a clean layout with a dedicated text area below for 'mutual consensus' messaging and supporting description. This 2-slide set includes both purple and blue color variants, allowing you to match your corporate branding or presentation theme. The slide structure combines visual data representation with ample space for context-specific messaging, making it ideal for family relationship assessments, organizational communication audits, consensus measurement, and stakeholder alignment presentations. Fully editable and ready to customize with your own data and messaging.
Usage Points
-
Main Usage
Visualize family or organizational relationship metrics using quantitative pie chart data to objectively measure communication levels and relationship strength. The chart enables intuitive comparison of proportional values across three categories, supporting data-driven decision-making and stakeholder communication.
-
How to Use
Deploy in family relationship improvement initiatives, organizational culture assessments, communication status reports, relationship satisfaction surveys, and consensus-building presentations. Replace chart values and descriptive text with your own data to create a customized, presentation-ready slide in minutes.
-
Recommended For
HR professionals, organizational development specialists, family counselors, corporate training managers, and market research teams presenting relationship or communication analysis findings. Ideal for anyone needing to quantify qualitative relationship data and present it persuasively to stakeholders.
-
Slide Structure
Two-slide layout with image area at top and information section at bottom. Top portion displays three pie charts showing percentage ratios; bottom section contains 'mutual consensus' title, subtitle, and editable text description area. Both slides maintain identical layout with color variation (purple and blue options).


