Magic Flow Chart for Business Strategy Visualization - Step-by-Step Planning
RJ0600042_13
- Last Update 07/02/2025
- File Size 0.4MB
- # of Slides 2
- File Format PPTX
- Slide Ratio 16:9
- Color
Keywords
- #Content-Based Slides
- #Design-Based Slides
- #Business Strategy
- #Diagram
- #Step-by-Step Schedule Plan
- #Flow
- #Linear Flow
- #Project Progress
- #16:9
- #arrow flow diagram PowerPoint
- #process flow diagram slide
- #business strategy visualization
- #step-by-step PowerPoint slide
- #how to create arrow diagram in PowerPoint
About the Product
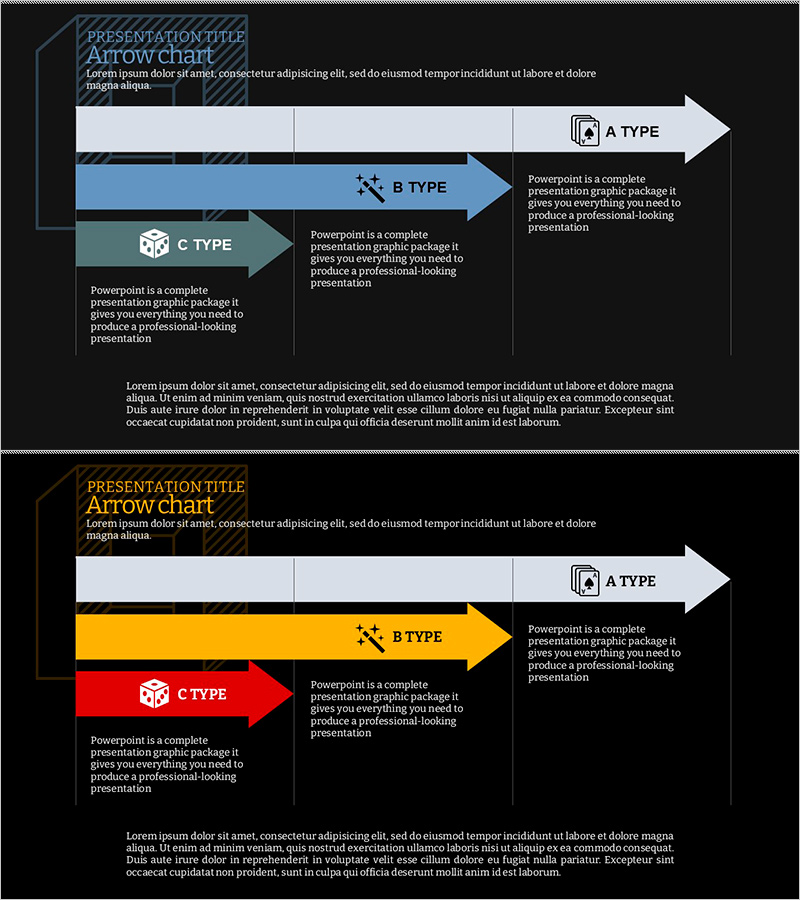
A PowerPoint slide featuring an arrow flow diagram to visualize business strategy in three sequential steps. The design uses a dark background with white, blue, yellow, and red arrow boxes, each paired with text description areas. The 2-slide set presents the first slide in blue tones and the second in yellow and red tones, allowing you to select the color scheme that best fits your presentation context. This PowerPoint slide template is ready to use for process flow, timeline planning, and progress reporting in business presentations.
Usage Points
-
Main Usage
This slide clearly communicates business strategy as a sequential process flow. The arrow diagram enables stakeholders—executives, team members, and clients—to quickly grasp each step's sequence, timeline, and responsibilities, making your strategy presentation more persuasive and logical.
-
How to Use
Click each arrow box to enter step name, duration, owner, and key activities. Customize text content directly in the template. Adjust arrow colors and sizes as needed. Use the blue-tone version to emphasize trust and stability; use yellow and red tones to highlight urgency and importance.
-
Recommended For
Ideal for business progress reports, strategy presentations, project timeline explanations, and organizational decision-making meetings. Recommended for executives, project managers, marketing professionals, and sales teams who need to communicate implementation plans, current status, and upcoming milestones clearly.
-
Slide Structure
2-slide set. Each slide features a dark background with 3 arrow boxes arranged left-to-right, paired with text description areas on the side. The first slide uses blue tones; the second uses yellow and red tones, giving you flexibility to match your presentation style.
Related Products
-

Business Progress Steps Slide – Clear Progress Flow
#Business Strategy #Diagram #Step-by-Step Schedule Plan
-

Annual Match Plan and Strategy – Vision and Growth
#Business Strategy #Diagram #Other
-

Companion Flow Diagram – Visualizing Business Strategy
#Business Strategy #Diagram #Step-by-Step Schedule Plan
-

Visual Diagram of Cultural Experience Program Order
#Business Strategy #Diagram #Step-by-Step Schedule Plan
