Meal Concept Pie Chart – Market Share Analysis
RJ0600054_5
- Last Update 07/05/2025
- File Size 2.4MB
- # of Slides 2
- File Format PPTX
- Slide Ratio 16:9
- Color
Keywords
About the Product
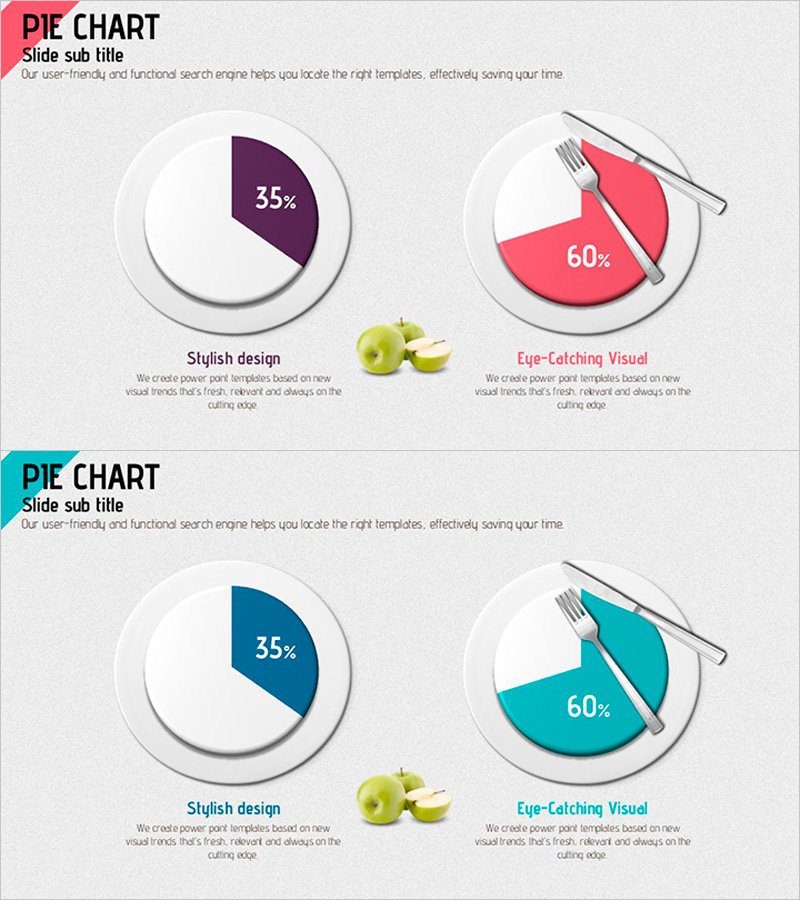
A PowerPoint pie chart slide set designed for visualizing market share, sales ratios, and consumption composition in food and dining contexts. Presented in two color versions—purple and coral pink—each slide features both a standard circular pie chart and a three-dimensional food-themed pie chart with fork accent. Specific percentages (35%, 60%) can be displayed to represent market analysis, consumer preference surveys, and sales distribution. The 16:9 widescreen format with 2 slides allows immediate insertion into presentations for quick data visualization without additional design work.
Usage Points
-
Main Usage
Clearly illustrates proportional relationships between 2–3 data categories such as market share, sales distribution, consumer preferences, and product composition. Ideal for food, beverage, restaurant, and retail industry presentations to communicate consumption patterns, market conditions, and customer demographics at a glance.
-
How to Use
Select between the standard circular pie chart and the three-dimensional food-themed version based on presentation context. Edit the percentages (35%, 60%, etc.) with actual data and adjust colors to match corporate branding. Insert into marketing reports, business plans, and market analysis documents in the data visualization section.
-
Recommended For
Marketing teams presenting market research findings, sales teams reporting performance metrics, food and beverage industry business proposals, consumer analysis reports, and product portfolio presentations. Suitable for executive briefings, investor pitches, and client proposals.
-
Slide Structure
2-slide set with two color versions (purple and coral pink). Each version includes one standard circular pie chart and one three-dimensional food-themed pie chart with fork decoration. Charts are divided into 2–3 segments with percentage labels and descriptive text areas for customization.
Related Products
-

Agricultural Equipment Investment Plan Pie Chart
#Market and Competitor Analysis #Graph #Market Status
-

City and Nature Pie Chart Statistics – Visualization of Market Status
#Market and Competitor Analysis #Graph #Market Status
-

Pie Chart for Workout Type Preferences – Market Status
#Market and Competitor Analysis #Diagram #Graph
-

Pie Chart Slide Visualizing Transportation Status
#Market and Competitor Analysis #Graph #Market Status
