Effective Visualization Slide for Target Area Survey – Successful Marketing Strategy
RJ0600039_16
- Last Update 07/01/2025
- File Size 3.2MB
- # of Slides 2
- File Format PPTX
- Slide Ratio 16:9
- Color
Keywords
About the Product
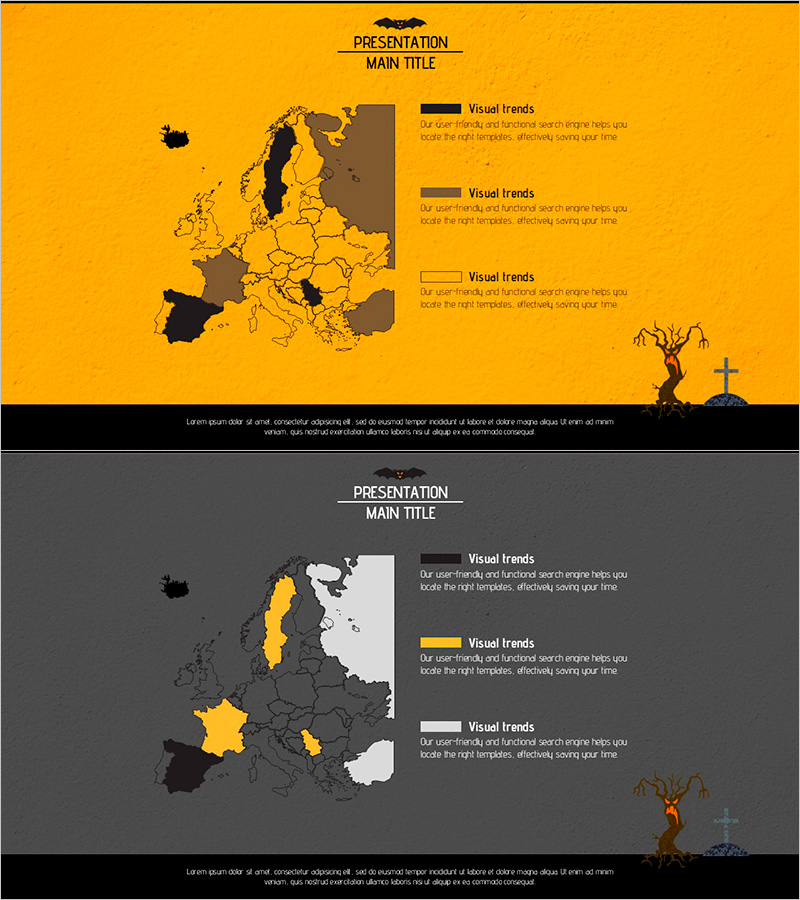
A professional PowerPoint slide designed to visualize target regional market conditions effectively. This two-slide presentation features a gold and charcoal dual-tone background with a Europe map layout, optimized for regional data comparison and marketing strategy development. The left side displays a map with country-specific highlighted areas in distinct colors, while the right side includes three text description areas for clear market analysis communication. Ready to use immediately in presentations, business plans, and marketing strategy documents as a regional strategy section.
Usage Points
-
Main Usage
Visualize target regional market conditions and competitive landscape using map-based design to support strategic decision-making. Combine regional highlighted areas with text descriptions to clearly present regional analysis evidence when developing marketing strategies.
-
How to Use
Highlight target countries or regions on the left map using distinct colors, then input market size, competitor information, and market entry strategies in the right text areas. The two-slide structure allows sequential presentation of current situation analysis and strategic direction, enhancing audience comprehension.
-
Recommended For
Ideal for marketing managers, business development teams, and executive reporting. Suitable for new market entry planning, regional sales strategy presentations, and global expansion roadmap discussions as a regional analysis section.
-
Slide Structure
Slide 1: Gold background with Europe map and three highlighted regions plus three text boxes on the right. Slide 2: Charcoal background with Europe map and different highlighted regions plus three text boxes on the right. Each slide is designed with a regional comparison structure.
Related Products
-

Map of Enlightenment Period – Template for Market and Competitor Analysis
#Market and Competitor Analysis #Marketing Plan and Strategy #Text Box
-

Trend Color Wide Template – Market and Distribution Strategy Analysis
#Market and Competitor Analysis #Marketing Plan and Strategy #Other
-

World Map Data Slide | Regional Statistics Visualization PPT
#Market and Competitor Analysis #Marketing Plan and Strategy #Other
-

Major Fruit Transaction Ratio – Market Analysis and Strategy
#Market and Competitor Analysis #Marketing Plan and Strategy #Other
