Football Result Table – Sports Data Visualization
RJ0600037_11
- Last Update 06/30/2025
- File Size 0.6MB
- # of Slides 2
- File Format PPTX
- Slide Ratio 16:9
- Color
Keywords
About the Product
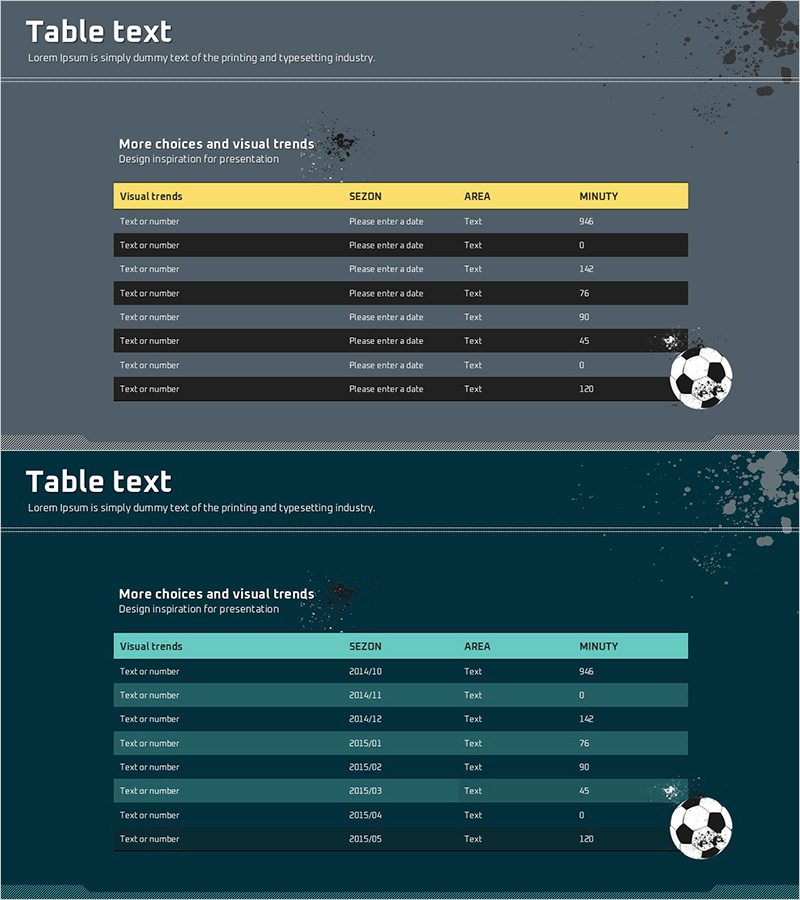
A table-format PowerPoint slide for organizing football match results and sports statistics. Features a 4-column table (Visual trends, SEZON, AREA, MINUTY) with yellow header and dark gray rows that clearly distinguish data categories. Includes 2 slide designs: a gray background version and a teal background version, allowing you to match your presentation tone. Ideal for sports analytics, league standings, team performance reports, and quantitative data visualization in presentations.
Usage Points
-
Main Usage
Organize and present quantitative sports data such as match results, league standings, and team performance statistics in table format. The yellow-highlighted 4-column header (Visual trends, SEZON, AREA, MINUTY) clearly distinguishes each data category, enhancing audience comprehension and data retention.
-
How to Use
Use in sports analysis presentations, team performance reports, and league statistics slideshows to organize match results and player performance metrics. The gray background version suits formal reporting environments, while the teal version works well for casual team meetings. Simply replace row text with your own data for immediate use.
-
Recommended For
Sports marketing professionals, team managers, sports analysts, physical education instructors, and sports media producers presenting match analysis, team performance evaluations, and league statistics. Adaptable for organizing data across various sports beyond football.
-
Slide Structure
Two-slide design featuring a gray background with yellow header table on the first slide and a teal background with teal header table on the second. Each table contains 4 columns (Visual trends, SEZON, AREA, MINUTY) and 8 data rows, with a football illustration positioned on the right to reinforce the sports theme.
Related Products
-

Step-by-Step Pricing Strategy Presentation Slide
#Business Strategy #Marketing Plan and Strategy #Diagram
-

Wide Template Diagram for Cars – A New Way to Present Products
#Product/Service Introduction #Business Introduction #Diagram
-

SWOT Analysis Closed Diagram – Enhancing Market and Competitor Understanding
#Market and Competitor Analysis #Diagram #SWOT Analysis
-

Budget Diagram by Item – Visual Representation of Budget Planning
#Financial Plans and Performance #Diagram #Capital Requirements
