Aurora Camping Business Goal Diagram – Clear Vision Communication
RJ0600032_4
- Last Update 06/29/2025
- File Size 0.8MB
- # of Slides 2
- File Format PPTX
- Slide Ratio 16:9
- Color
Keywords
- #Content-Based Slides
- #Design-Based Slides
- #Company Introduction
- #Product/Service Introduction
- #Diagram
- #Business Areas
- #Product/Service Introduction
- #Cluster
- #Chain Diagram
- #16:9
- #linear diagram PowerPoint
- #4-step connection diagram
- #process flow slide template
- #business goal diagram
- #vision communication PowerPoint slide
About the Product
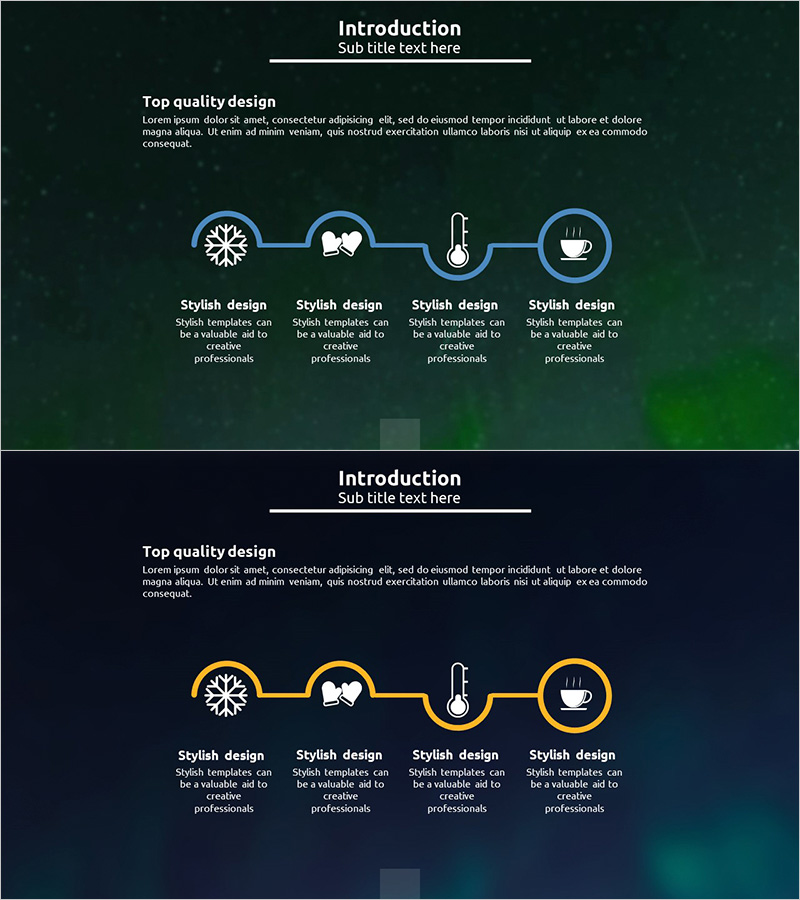
A 4-step linear connection diagram PowerPoint slide that communicates business goals and vision sequentially. Symbolic icons—snowflake, book, thermometer, and coffee cup—represent each stage, while blue circular nodes and connecting arrows clearly express process flow. Optimized for 16:9 widescreen in a 2-slide set, ready for executive presentations, strategy briefings, and project kickoffs. Each stage includes a text area below for detailed descriptions, and colors and icons are fully editable to match your brand or presentation theme.
Usage Points
-
Main Usage
Visualize business goals, strategies, and processes in sequential stages to communicate a clear vision to your audience. Iconic symbols make complex concepts intuitive, while linear flow emphasizes step-by-step progression and logical sequence.
-
How to Use
Use in executive presentations, strategy briefings, project kickoffs, business plan explanations, and organizational change management. Add stage-specific details, objectives, and owner information in the text areas below each node to provide comprehensive context.
-
Recommended For
Executives, project managers, strategy planners, marketing professionals, and organizational development specialists presenting business goals, strategic roadmaps, project phases, or change management plans. Ideal for emphasizing 4–5-stage sequential processes in any business context.
-
Slide Structure
2-slide set featuring 4 blue circular nodes connected by arrows in linear arrangement. Each node displays a symbolic icon (snowflake, book, thermometer, coffee cup) with editable text area below. Dark green gradient background highlights icons and text for visual impact.
Related Products
-

Business Areas of Work Circle Diagram – Organizational Status and Vision
#Company Introduction #Business Introduction #Diagram
-

Pencil Shape Diagram – Cluster for Business Introduction
#Company Introduction #Business Introduction #Diagram
-

Arrow Link Diagram – Business Introduction and Connections
#Company Introduction #Business Introduction #Diagram
-

Business Area Connection Diagram – Effective Business Introduction
#Company Introduction #Business Introduction #Diagram
