Bar Graph for Camping Competitor Survey
RJ0600032_11
- Last Update 06/29/2025
- File Size 0.8MB
- # of Slides 2
- File Format PPTX
- Slide Ratio 16:9
- Color
Keywords
About the Product
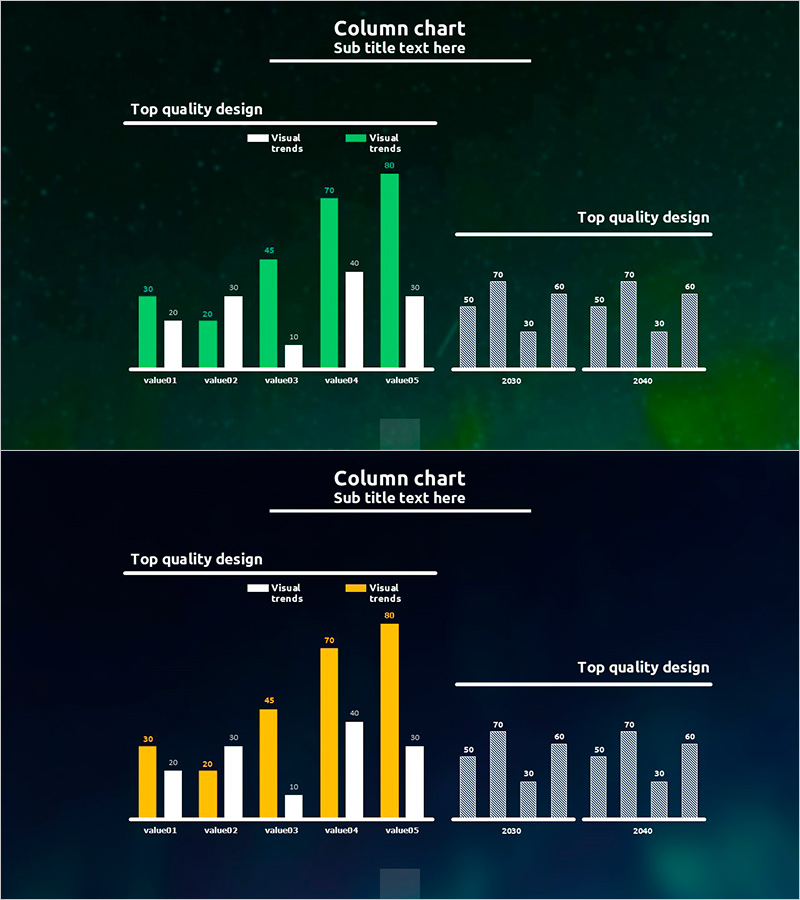
A horizontal bar chart PowerPoint slide designed for visualizing camping industry competitor survey data. The slide features two data series (Visual trends in gray and green) comparing five competitor items side by side, with numerical labels displayed above each bar for precise data reading. The dark background (deep green and black) with white text and bright-colored bars creates high contrast visibility for presentation screens. The 2-slide set presents the same data in different color combinations, allowing you to choose the best option for your presentation context. Fully editable PPTX format enables quick customization with your own competitive data.
Usage Points
-
Main Usage
Visualize numerical comparisons between competitors and analyze market share or performance metrics. Ideal for competitive positioning in market research reports, executive briefings, and investor pitch decks within the camping, leisure, and tourism sectors.
-
How to Use
Open the slide and replace existing data with your competitor figures. Modify bar lengths and numerical labels accordingly, and update the legend series names (Visual trends) as needed. Select either the dark green or dark black background slide version based on your presentation environment.
-
Recommended For
Marketing professionals, executives, consultants, and research teams presenting competitive analysis findings. Suitable for strategy meetings, board reports, and client proposals in camping, leisure, tourism, consumer goods, and retail industries.
-
Slide Structure
Slide 1: Green horizontal bars with 2 data series (Visual trends gray and green) + 5 competitor items (value01 to value05) + numerical labels + dark green background. Slide 2: Yellow horizontal bars with 2 data series (Visual trends gray and yellow) + same 5 items + numerical labels + dark black background. Additional chart area on the right side of each slide showing year-based data (2030, 2040).
Related Products
-

Architectural Illustration Template Radial Chart – Customer Analysis Visualization
#Market and Competitor Analysis #Graph #Customer Analysis
-

Food Ingredient Characteristics Radar Chart – Features and Benefits
#Product/Service Introduction #Diagram #Graph
-

Segmented Vertical Bar Chart Template for Analyzing Car Sales
#Market and Competitor Analysis #Marketing Plan and Strategy #Graph
-

User Analysis Graph by Age Group – Advanced Data Insights
#Market and Competitor Analysis #Diagram #Graph
