Service and System Operation Plan Diagram – Effective Visual Communication
RJ0600028_27
- Last Update 06/28/2025
- File Size 4MB
- # of Slides 2
- File Format PPTX
- Slide Ratio 16:9
- Color
Keywords
- #Content-Based Slides
- #Design-Based Slides
- #Technical Approach
- #Diagram
- #Service Architecture Diagram
- #System Architecture Diagram
- #Spread
- #Radial Diagram
- #16:9
- #radial diagram PowerPoint
- #service architecture slide
- #system diagram presentation
- #how to create radial diagram in PowerPoint
- #technical presentation template
About the Product
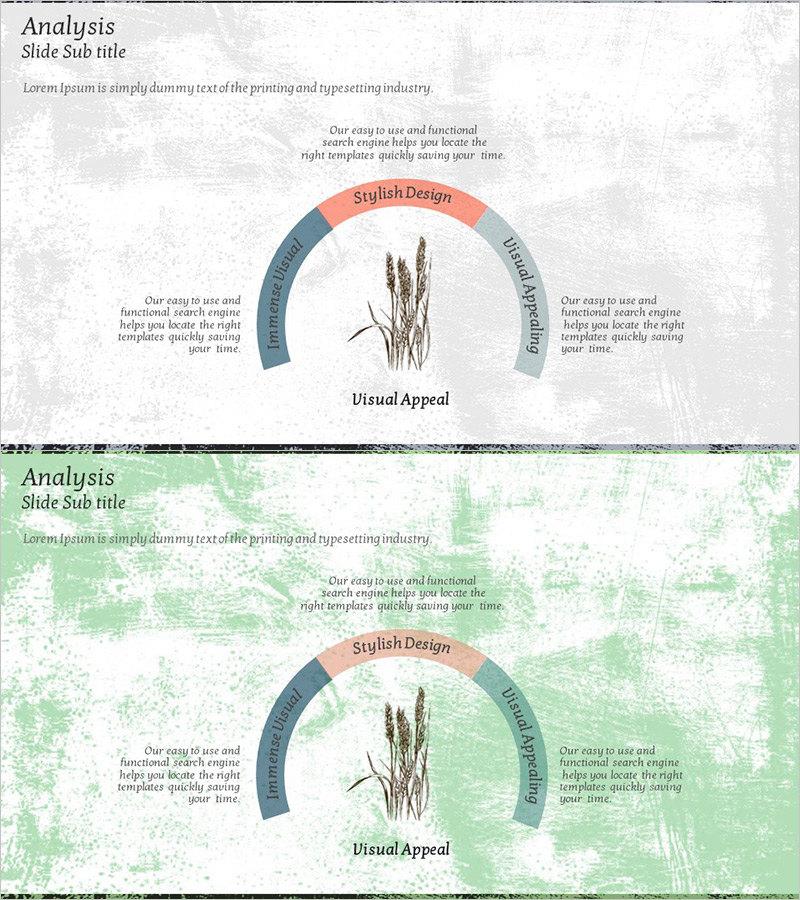
A radial diagram PowerPoint slide featuring three sectors radiating from a central point. The design uses a gray textured background with coral pink, steel blue, and gray arc segments representing service, system, and visual communication domains. A botanical illustration anchors the center, flanked by symmetrical text areas that clearly convey each sector's function. This 2-slide set is ready to use for technology presentations, service architecture briefings, and system operation planning discussions.
Usage Points
-
Main Usage
Visually represents core service or system components radiating from a central concept. Ideal for technology briefings, system architecture explanations, and service operation planning where you need to show how multiple domains relate to a central hub and to each other.
-
How to Use
Enter your core concept (e.g., Visual Appeal, system name) at the center and add sector names and descriptions to each of the three arc segments. Populate the left and right text areas with detailed explanations to enhance audience comprehension. Colors are fully editable to match your corporate branding.
-
Recommended For
IT professionals, system engineers, service strategists, and executives preparing technical briefings. Suitable for new service launches, system improvement proposals, organizational structure explanations, and business process analysis presentations.
-
Slide Structure
2-slide set. Each slide features a central botanical illustration with three arc segments (coral pink, steel blue, gray) radiating outward. Symmetrical text input areas flank the diagram to accommodate sector descriptions. Formatted in 16:9 widescreen ratio for modern presentation environments.
Related Products
-

Core Values Linked to the Central System
#Technical Approach #Diagram #Service Architecture Diagram
-

Trial Tree Structure – Legal and Service Overview
#Technical Approach #Diagram #Service Architecture Diagram
-

Chromosome Theme Wide PowerPoint Template – Stylish Diagram Composition
#Technical Approach #Diagram #Service Architecture Diagram
-

Pet Template Tree Structure – Optimized Visual for Service Diagram
#Technical Approach #Diagram #Service Architecture Diagram
