Show Business Activity by Region in the U.S.A – Market Analysis Presentation
RJ0600027_24
- Last Update 06/27/2025
- File Size 0.3MB
- # of Slides 2
- File Format PPTX
- Slide Ratio 16:9
- Color
Keywords
- #Content-Based Slides
- #Design-Based Slides
- #Company Introduction
- #Market and Competitor Analysis
- #Other
- #Domestic Network
- #Market Analysis
- #16:9
- #U.S. map PowerPoint slide
- #regional business activity presentation
- #market analysis map slide
- #United States regional visualization
- #business activity marker PPT
About the Product
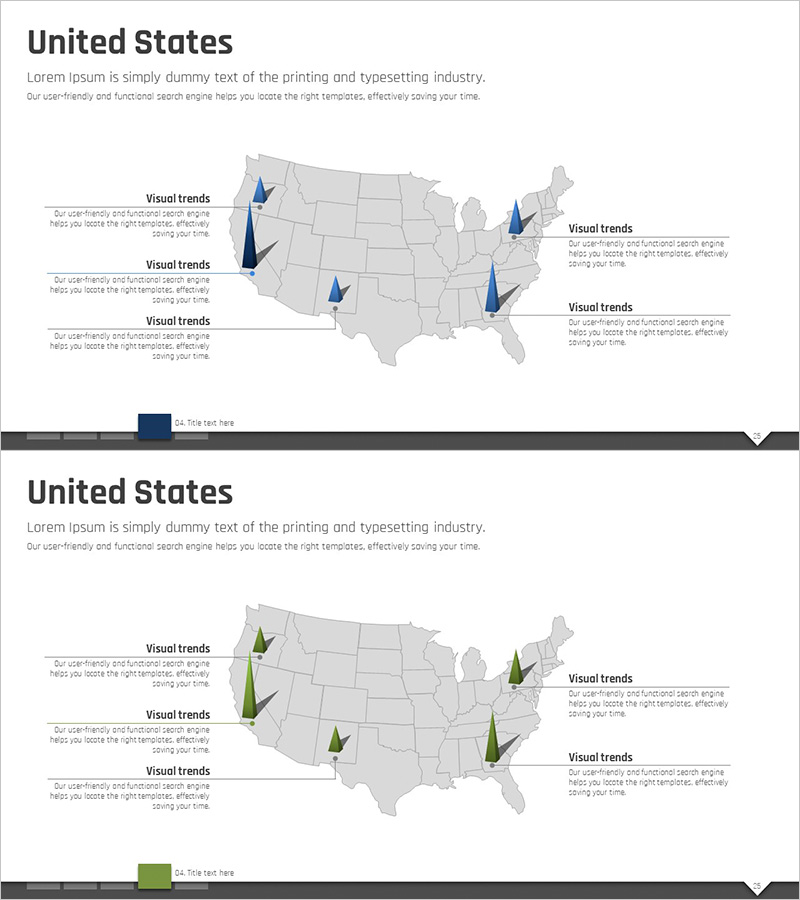
A PowerPoint slide that visualizes business activity across five key regions of the United States using a geographic map. The gray background map features dark blue and green accent markers to highlight regional business operations, with four 'Visual trends' text boxes positioned on both left and right sides for adding region-specific descriptions. Formatted in 16:9 widescreen with 2 slides total, this presentation resource is ready to use for market analysis, regional strategy, and business performance presentations.
Usage Points
-
Main Usage
Provides geographic visualization of the U.S. market segmented by region, enabling stakeholders to understand business activity distribution at a glance. Effectively communicates regional business strategies to investors, partners, and employees during market analysis presentations.
-
How to Use
Enter region-specific business performance, achievements, and plans into the four text boxes on each slide. Customize marker colors as needed to distinguish regional categories. Use the map highlights to draw attention during presentations and guide the audience through regional analysis sequentially.
-
Recommended For
Ideal for executives, marketing teams, sales departments, and business development teams presenting market analysis and regional strategies. Particularly suited for U.S. market entry, regional expansion initiatives, market share analysis, and region-based decision-making materials.
-
Slide Structure
Two-slide layout with the U.S. map centered and four text boxes arranged on each side. The first slide uses dark blue markers while the second uses green markers, allowing comparison between different regional groups or time-period analysis.
Related Products
-

Regional Competitive Advantage Chart – Essential Tool for Market and Competitor Analysis
#Company Introduction #Market and Competitor Analysis #Graph
-

Market Analysis with Map Infographic Illustration – Strategies for Business Success
#Company Introduction #Market and Competitor Analysis #Other
-

Aurora Analysis by US Region – Visualization for Insights
#Company Introduction #Market and Competitor Analysis #Other
-

Target Area Line Graphic – Powerful Visual Presentation
#Company Introduction #Product/Service Introduction #Other
