Tricolor Overlapping Diagram – Business Strategy Representation
RJ0600008_4
- Last Update 06/23/2025
- File Size 0.1MB
- # of Slides 2
- File Format PPTX
- Slide Ratio 16:9
- Color
Keywords
- #Content-Based Slides
- #Design-Based Slides
- #Business Vision and Strategy
- #Technical Approach
- #Diagram
- #Business Strategy
- #Service Implementation Plan
- #Cluster
- #Combination Diagram
- #16:9
- #overlapping diagram PowerPoint
- #Venn diagram slide template
- #three-color circle diagram
- #business strategy presentation slide
- #intersection diagram PowerPoint template
About the Product
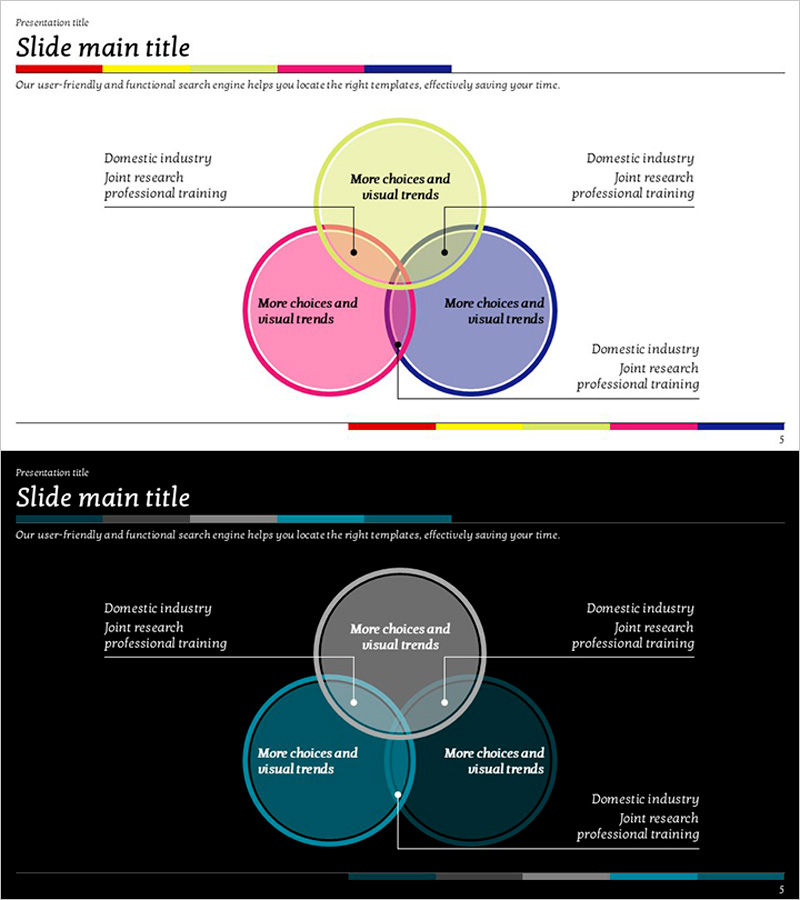
A Venn diagram PowerPoint slide featuring three overlapping circular shapes that emphasize intersection areas. Divided by pink, yellow, and blue colors, each area accommodates text input for visualizing relationships between three business elements such as strategy, organizational structure, or market analysis. The 2-slide set includes both light and dark background versions for flexible presentation environments. Arrows and text boxes are positioned at circle centers and intersection points to clearly communicate key messages and strategic intersections.
Usage Points
-
Main Usage
Optimized for visually representing relationships between three elements and their intersections. Ideal for business strategy presentations highlighting intersections between departments, markets, or customer segments. Effective for organizational charts showing overlapping roles and responsibilities. Excellent for educational seminars explaining conceptual relationships and dependencies.
-
How to Use
Enter three item names in the text boxes of each circular shape and write key messages in the central intersection area. Colors can be retained or customized to match corporate branding. Use the light background version for daytime presentations and the dark version for evening events or sophisticated atmospheres.
-
Recommended For
Recommended for executive strategy presentations, marketing team market analysis reports, organizational development structure explanations, consulting firm strategy proposals, and university lectures on conceptual frameworks. Suitable for any business presentation requiring emphasis on three-area relationships and strategic intersections.
-
Slide Structure
Three circular shapes of approximately equal diameter positioned to overlap at the center. Each circle contains text such as 'More choices and visual trends,' with the central intersection area reserved for emphasis text. Left and right sections include additional descriptive text areas like 'Domestic industry joint research professional training.' A color-coded bar at the bottom visually distinguishes each area's meaning and category.
Related Products
-

Overlapping Diagram for Business Strategy Visualization – Blue and Yellow
#Business Vision and Strategy #Technical Approach #Diagram
-

Circular Connection Overlapping Diagram – Business Vision and Strategy
#Business Vision and Strategy #Diagram #Business Strategy
-

Differentiated Fashion Strategy Slide – Business Vision and Strategy
#Product/Service Introduction #Business Vision and Strategy #Diagram
-

School Icon Curved Diagram
#Business Vision and Strategy #Technical Approach #Diagram
