Animal Farm Infographic Diagram – Visualizing Operational Plans
RJ0600019_27
- Last Update 06/26/2025
- File Size 0.4MB
- # of Slides 2
- File Format PPTX
- Slide Ratio 16:9
- Color
Keywords
About the Product
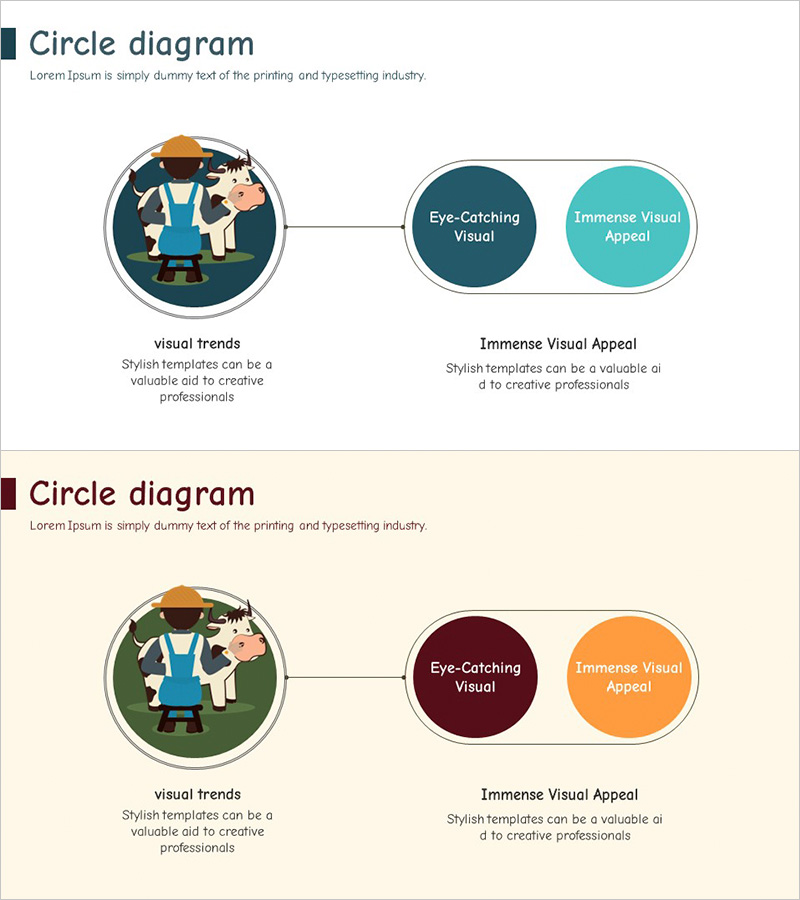
A relationship diagram PowerPoint slide featuring circular nodes connected by linking lines. The structure flows from a left-side circular illustration node to two right-side circular text nodes in a two-tier hierarchy, visually representing relationships between core concepts and supporting elements. The dark blue, turquoise, and orange color palette emphasizes visual hierarchy and works effectively for explaining processes, organizational relationships, and strategic connections in presentations. Delivered as a 16:9 PPTX file with 2 slides, fully editable and ready to customize.
Usage Points
-
Main Usage
Optimized for visualizing relationships between a core concept and its derivative elements. Ideal for organizational structures, strategic connections, process flows, and conceptual classifications requiring two-tier relationship mapping in any business presentation.
-
How to Use
Place your core topic or central concept in the left circular illustration area, then input supporting details in the two right circular text boxes. Follow the connecting lines to explain logical flow, and freely edit colors and text to match your presentation theme and content requirements.
-
Recommended For
Executives, strategists, marketers, and project managers presenting organizational changes, new business initiatives, technology architecture, or strategic frameworks. Suitable for board presentations, investor pitches, team meetings, training seminars, and corporate communications.
-
Slide Structure
Two-slide set with the first slide featuring a dark blue background, left circular illustration (character, animal, or icon), and two right circular text nodes (dark blue and turquoise) connected by lines. The second slide uses a beige background with the same structure in dark red and orange tones, providing flexibility for different presentation contexts.
Related Products
-

Vehicle Repair Service Strategy Diagram – Cluster Format
#Operational Plan #Diagram #Production and Technology Development Strategy
-

Summer Theme Multi-directional Arrows Business Template
#Product/Service Introduction #Operational Plan #Diagram
-

E-Learning Learning Effect Diagram – Visualizing Business Strategies
#Business Vision and Strategy #Business Strategy #Diagram
-

Construction Safety Management System Slide – Visual Risk Management
#Operational Plan #Diagram #Production and Technology Development Strategy
