Media Psychological Treatment Process Diagram – Risk Management and Solutions
RJ0800025_20
- Last Update 08/06/2025
- File Size 1MB
- # of Slides 2
- File Format PPTX
- Slide Ratio 16:9
- Color
Keywords
About the Product
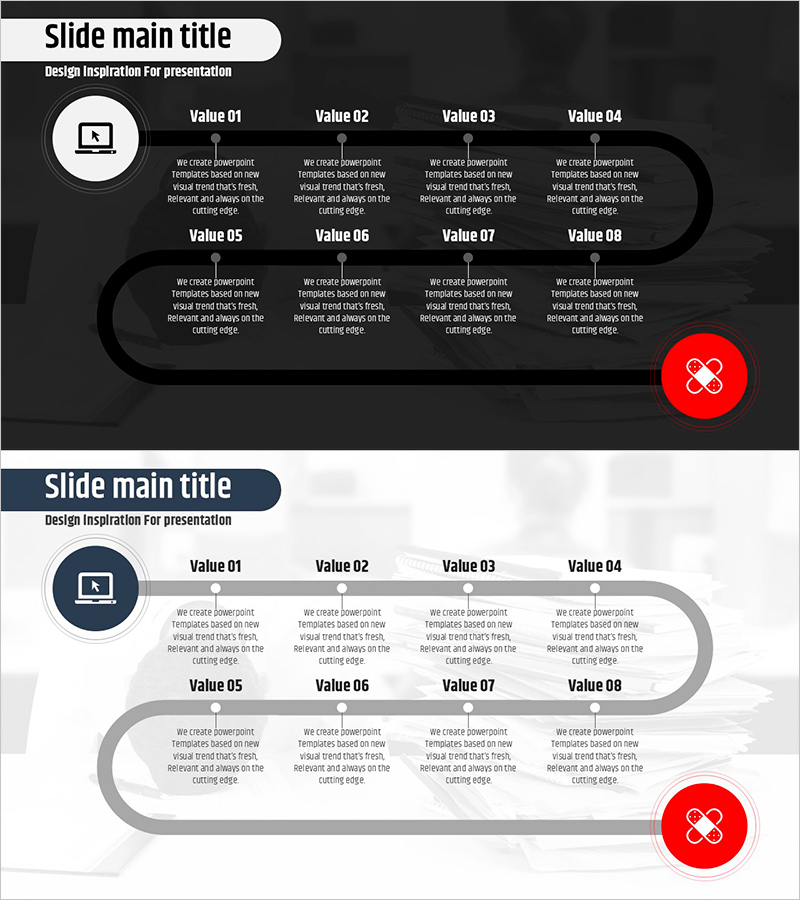
A connected diagram PowerPoint slide visualizing psychological treatment and risk management processes across 8 sequential steps. The design features a dark background with white typography and red accent elements that clearly illustrate the relationship between each stage. Starting from a circular icon on the left and concluding with a red circular button on the right, this linear flow structure effectively presents complex processes in a step-by-step manner. Available in 16:9 widescreen format with 2 fully editable slides, suitable for medical presentations, counseling sessions, organizational management, quality assurance, and strategic planning documents.
Usage Points
-
Main Usage
Ideal for explaining step-by-step processes including psychological treatment, counseling workflows, risk management strategies, and problem-solving approaches. The arrow-connected nodes and clear visual hierarchy help audiences quickly grasp the entire process flow and understand interdependencies between stages.
-
How to Use
Enter the process starting point in the left icon area, then fill in the 8 Value boxes with stage-specific descriptions. Use the red button on the right to highlight the final outcome or key action items. All colors and text are fully customizable to match your brand or presentation theme.
-
Recommended For
Healthcare professionals, psychologists, organizational development specialists, project managers, quality assurance teams, and educators presenting complex workflows. Particularly effective for clinical case presentations, organizational improvement initiatives, risk mitigation strategies, and training sessions requiring systematic process explanation.
-
Slide Structure
Two-slide set featuring dark background theme on slide 1 and light background theme on slide 2. Each slide contains a circular icon on the left (1 node), 8 text boxes arranged in 4-top and 4-bottom layout, and a red circular accent button on the right for emphasis.
Related Products
-

Marriage Conflict Diagrams – Effective Solutions
#Operational Plan #Diagram #Risk Management
-

Carbon Neutral Solution Connection Diagram
#Operational Plan #Diagram #Risk Management
-

Single Slide Template for Visualizing Stages of Lung Cancer
#Business Strategy #Diagram #Step-by-Step Schedule Plan
-

Travel Directions Diagram Slide – Risk Management and Solutions
#Operational Plan #Diagram #Risk Management
