Carbon Neutral Profit Forecast and Expected Effect Diagram
RJ0600018_32
- Last Update 06/25/2025
- File Size 0.5MB
- # of Slides 2
- File Format PPTX
- Slide Ratio 16:9
- Color
Keywords
- #Content-Based Slides
- #Design-Based Slides
- #Technical Approach
- #Diagram
- #Service Implementation Plan
- #Cluster
- #Combination Diagram
- #Chain Diagram
- #16:9
- #overlapping bubble diagram PowerPoint
- #cluster diagram slide template
- #4-node relationship diagram
- #Venn diagram PowerPoint template
- #interconnected concept visualization slide
About the Product
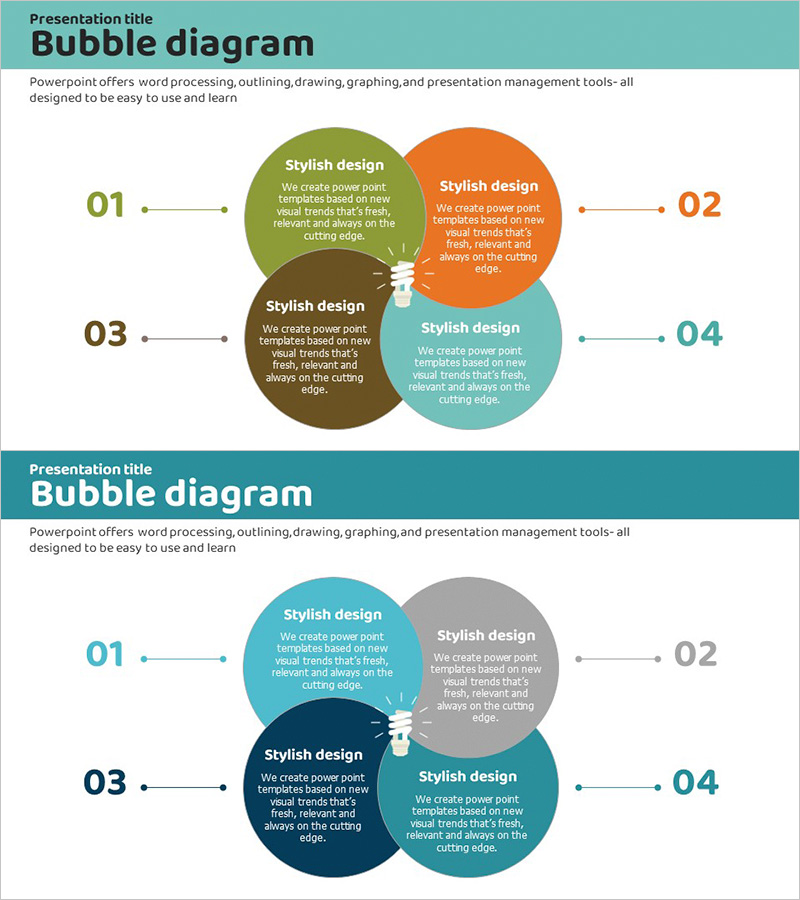
A multi-node overlapping cluster diagram PowerPoint slide featuring four circular bubbles intersecting at the center with external numbered labels (01–04) and dotted connector lines. The design uses olive, orange, brown, and teal color schemes to visually distinguish each element while emphasizing the central intersection area for shared concepts. Each bubble contains editable title and description text, making it ideal for presenting interconnected strategies, effects, revenue forecasts, and expected outcomes. Provided as a 2-slide set in 16:9 widescreen format with fully customizable colors, text, and node sizes.
Usage Points
-
Main Usage
Visualizes four interconnected concepts, strategies, or effects simultaneously with emphasis on their shared intersection. The overlapping design effectively communicates common ground, integration points, or unified messaging, making it suitable for business strategy, market analysis, organizational structures, and project relationship mapping.
-
How to Use
Enter title and description text into each bubble, then modify external number labels to match your presentation content. Customize colors to represent priority levels or categories, and add icons or key messages to the central intersection area to enhance emphasis and visual impact.
-
Recommended For
Executives, planning teams, marketing professionals, and strategy leaders presenting business strategies, revenue structures, expected outcomes, and market analysis. Effective for consulting reports, investor presentations, strategic planning meetings, and project kickoff presentations where complex relationships require clear visual representation.
-
Slide Structure
Two-slide set with four circular nodes intersecting at the center in a Venn diagram format. First slide features olive, orange, brown, and teal color arrangement; second slide presents teal, gray, navy, and teal variation. Each node is independently editable with external numbered labels and dotted connector lines included throughout.
Related Products
-

Systematic Nested Diagram – Business Strategy Visualization
#Business Strategy #Technical Approach #Diagram
-

Business Strategy Connected Diagram – Workflow and Technical Execution
#Operational Plan #Technical Approach #Diagram
-

How to Deal with a Crisis in Case of an Accident - Effective Risk Management Tool
#Operational Plan #Risk Management and Regulatory Compliance #Diagram
-

Cloud System Service Configuration Diagram – Modern Design and Visual Appeal
#Technical Approach #Diagram #Service Architecture Diagram
