Carbon Neutral Infographic Wave Chart
RJ0600018_12
- Last Update 06/25/2025
- File Size 12.7MB
- # of Slides 2
- File Format PPTX
- Slide Ratio 16:9
- Color
Keywords
- #Content-Based Slides
- #Design-Based Slides
- #Market and Competitor Analysis
- #Graph
- #Competitor Analysis
- #Market Analysis
- #Line
- #Bell Curve
- #16:9
- #wave chart PowerPoint
- #wave graph presentation
- #carbon neutral infographic slide
- #time-series data visualization
- #environmental policy presentation
- #sustainability PPT template
About the Product
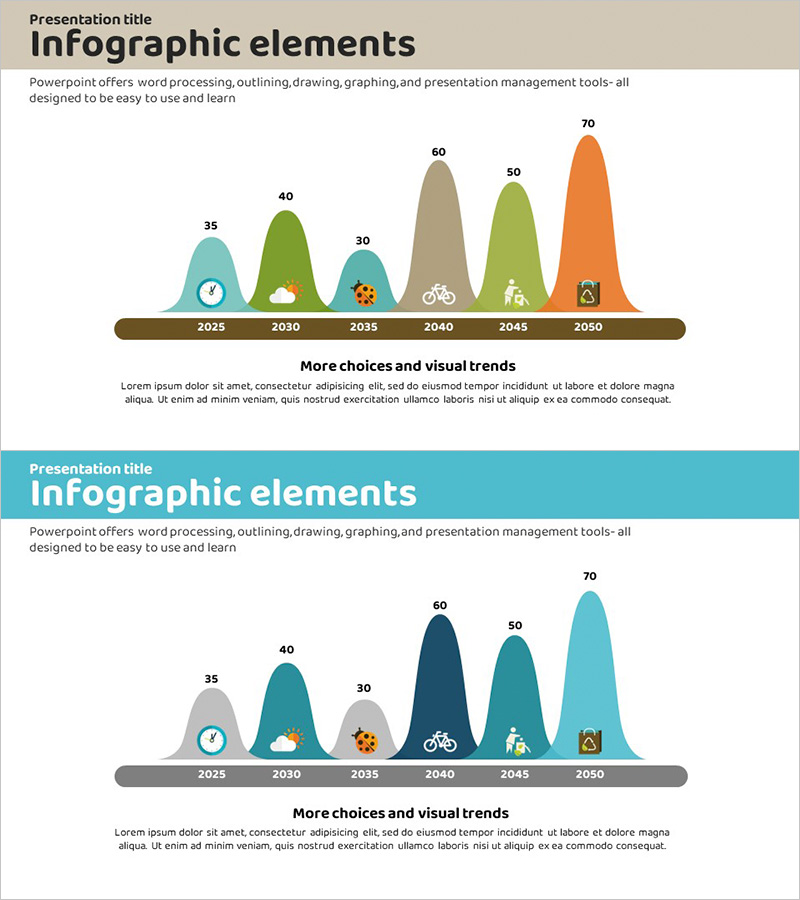
A PowerPoint slide visualizing carbon neutrality targets through a 6-stage wave chart spanning 2025 to 2050. Each stage displays numerical values (35, 40, 30, 60, 50, 70) represented as mountain-shaped curves, with corresponding icons (clock, cloud, bicycle, people, briefcase) positioned beneath each peak to enhance information clarity. The design employs a diverse color palette including beige, teal, green, taupe, and orange tones. Delivered as a 2-slide set in 16:9 widescreen format, this presentation template is ready for immediate use in environmental policy briefings, sustainability reports, and climate action presentations.
Usage Points
-
Main Usage
Communicates temporal data progression and peak points through wave-shaped curves, making carbon neutrality timelines and environmental milestones immediately comprehensible. Designed to convey sustainability targets and climate action strategies with visual impact.
-
How to Use
Deploy in corporate environmental presentations, government policy briefings, ESG reporting sessions, and climate strategy meetings. Replace stage values and icons with organization-specific data to create customized presentation materials aligned with your sustainability roadmap.
-
Recommended For
Environmental policy officers, sustainability report authors, climate action project leads, ESG executives, energy and environmental company marketing teams, government agencies, and university environmental science instructors preparing presentation materials.
-
Slide Structure
2-slide format featuring title area, central 6-stage wave chart (2025, 2030, 2035, 2040, 2045, 2050), numerical labels per stage, icon placement, and descriptive text zone at bottom. Optimized for 16:9 widescreen projection and online presentation delivery.
Related Products
-

Logistics Industry Progress Analysis Graph – Market Insight
#Market and Competitor Analysis #Graph #Competitor Analysis
-

Market Competitor Analysis with Clustered Vertical Bar Chart
#Market and Competitor Analysis #Graph #Competitor Analysis
-

Year-by-year Growth Trend Graph – Market and Competitor Analysis
#Market and Competitor Analysis #Graph #Competitor Analysis
-

Vertical Bar Cluster Analysis Graph – Market and Competitor Analysis
#Market and Competitor Analysis #Graph #Competitor Analysis
