Infographic Slide for Camping Company History
RJ0600014_6
- Last Update 06/24/2025
- File Size 1.2MB
- # of Slides 2
- File Format PPTX
- Slide Ratio 16:9
- Color
Keywords
About the Product
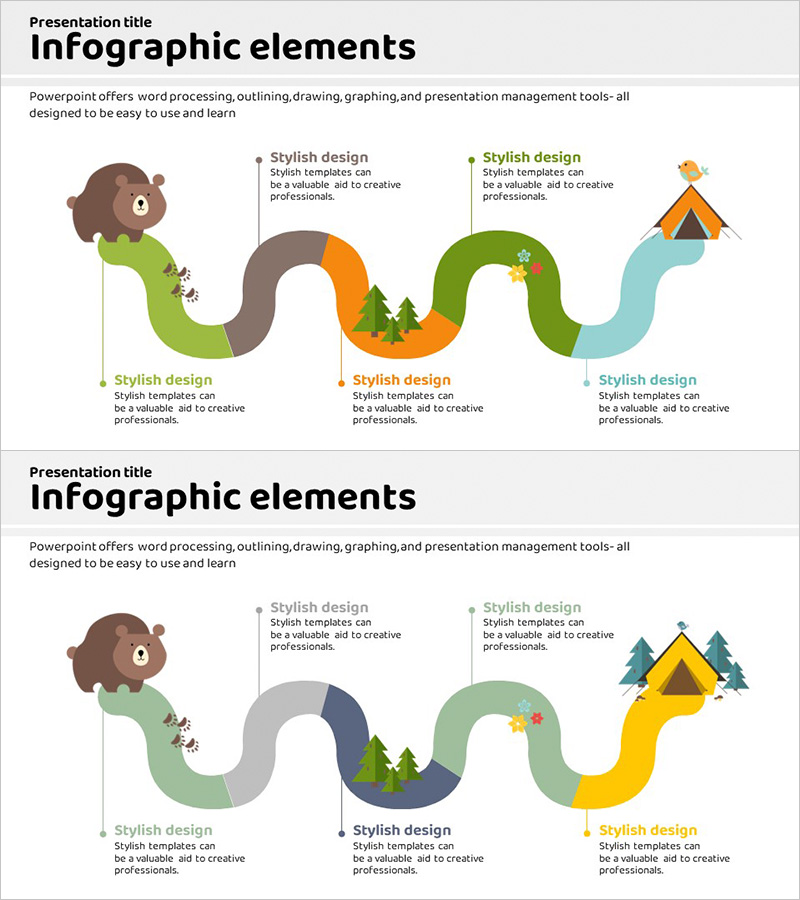
A 2-slide infographic PowerPoint presentation that visualizes company history and business progress through a circular flow diagram. The design features a 5-stage cycle with green, orange, and blue color gradients connected by curved pathways. Each node includes thematic illustrations (bear, tent, trees, mountain, campfire) and text descriptions, making it ideal for outdoor, travel, and lifestyle brands. Optimized for 16:9 widescreen format in PPTX, fully editable and ready to use in corporate presentations, annual reports, and marketing pitches.
Usage Points
-
Main Usage
Designed to visualize company milestones, business evolution, and growth stages in chronological order. The circular structure emphasizes continuous development and cyclical business models, allowing each stage to highlight key achievements and turning points in company history.
-
How to Use
Perfect for annual reports, business presentations, investor pitches, and marketing decks where you need to explain company history and growth trajectory. Simply edit the text and icons to match your brand, adjust colors to your corporate identity, and customize the timeline to your specific milestones. Two-slide layout provides flexible arrangement options.
-
Recommended For
Ideal for startups, SMEs, and companies in tourism, camping, travel, hospitality, and retail sectors. Recommended for executives, marketing teams, and business development professionals presenting company background and growth stories, especially for nature-focused, lifestyle, and wellness brands.
-
Slide Structure
Two-slide layout featuring a 5-node circular diagram with curved connecting pathways. Each node contains thematic illustrations, text description areas, and stage numbers. Color differentiation uses green, orange, blue, and yellow gradients to distinguish each stage, with icons representing journey progression.
Related Products
-

Diagram of Space Industry Progress
#Business Vision and Strategy #Business Strategy #Diagram
-

Renewable Energy Future Plan Roadmap Diagram
#Business Strategy #Diagram #Roadmap
-

Takeoff Strategy for Global Expansion – Business Vision and Initiative
#Business Vision and Strategy #Business Strategy #Diagram
-

Creative Ideas in Bloom – Business Strategy Tool
#Product/Service Introduction #Business Strategy #Diagram
