Sports Chart Diagram – Product and Service Presentation
RJ0600013_18
- Last Update 06/24/2025
- File Size 2MB
- # of Slides 2
- File Format PPTX
- Slide Ratio 16:9
- Color
Keywords
- #Content-Based Slides
- #Design-Based Slides
- #Product/Service Introduction
- #Diagram
- #Product/Service Introduction
- #Program Introduction
- #Cluster
- #Closed Cluster Diagram
- #16:9
- #closed cluster diagram PowerPoint
- #circular diagram slide template
- #product showcase presentation
- #3-item comparison slide
- #diagram PowerPoint template download
About the Product
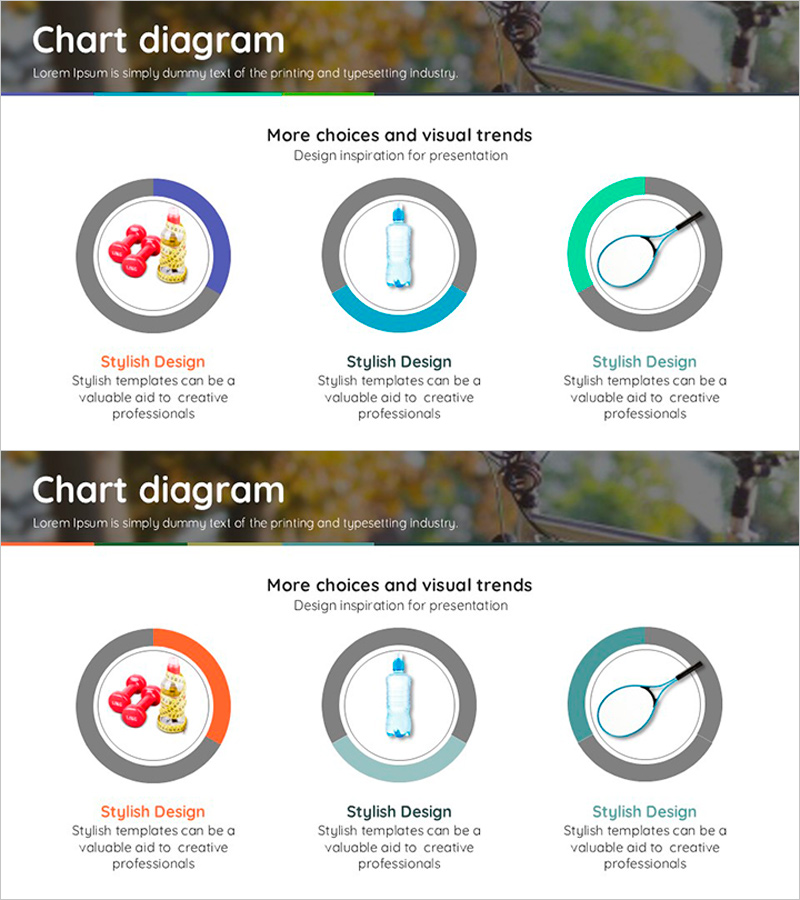
A closed cluster diagram PowerPoint slide optimized for product and service introductions. Three circular nodes are arranged around a central focal point, each with dedicated space for product images and descriptive text. The design features multi-colored outer rings in gray, blue, and teal tones that provide visual distinction and hierarchy. This presentation slide template is ideal for product portfolio comparisons, service category classifications, and business showcases. The 2-slide set includes color variations—one with gray-blue-teal accents and another with orange-blue-teal accents—allowing you to match your presentation theme or emphasize different sections.
Usage Points
-
Main Usage
Visually present product portfolios or service offerings organized into three categories. The central node emphasizes core messaging while surrounding elements clarify relationships, making it ideal for product line comparisons, service lineup introductions, and positioning strategy explanations.
-
How to Use
Insert product images into each circular node and add product names, features, or pricing details in the text areas below. Place your brand name, core value proposition, or shared characteristics in the central node to reinforce unity. Use the two color variations to differentiate sections or create emphasis across your presentation.
-
Recommended For
Product marketing professionals, sales presentations, product planning meetings, client proposals, portfolio showcases, product launch events, B2B sales materials, catalog presentations, executive reports, and investment pitch decks.
-
Slide Structure
2-slide set featuring a closed cluster layout with 1 central circular node and 3 surrounding nodes. Slide 1 uses gray, blue, and teal accent rings; Slide 2 features orange, blue, and teal variations. Each node includes separate image and text input areas for easy customization.
Related Products
-

Program Introduction Closed Diagram – Clear Structure and Communication
#Product/Service Introduction #Diagram #Product/Service Introduction
-

Introduction to Artificial Intelligence Robot Business Services – Innovative Solutions
#Product/Service Introduction #Diagram #Product/Service Introduction
-

Nursing Service Introduction PowerPoint Slide – Premium Cluster Design
#Product/Service Introduction #Diagram #Product/Service Introduction
-

Cluster Diagram for Innovative Business Program – Effective Information Delivery
#Product/Service Introduction #Diagram #Product/Service Introduction
