Cluster Diagram for Regional Features Analysis – Emotional Blue and Green
RJ0600009_19
- Last Update 06/23/2025
- File Size 5.3MB
- # of Slides 2
- File Format PPTX
- Slide Ratio 16:9
- Color
Keywords
About the Product
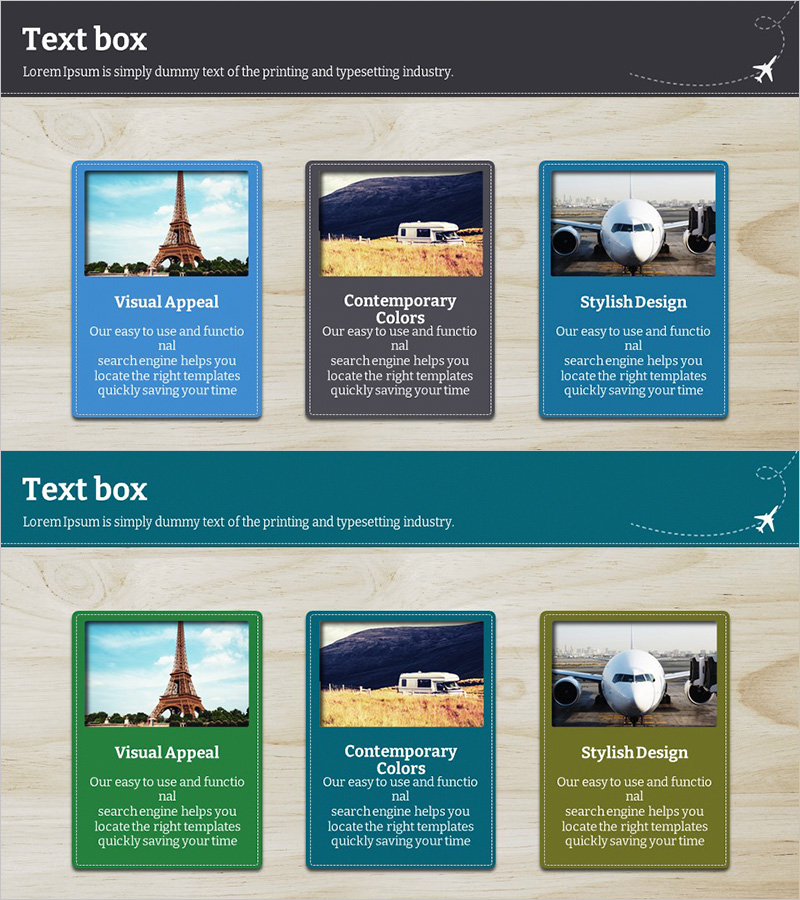
A closed-form cluster diagram PowerPoint slide designed to visually analyze and compare regional characteristics across multiple areas. The diagram features three overlapping regions expressed in a closed-form structure with emotional blue and green color tones, allowing you to clearly organize detailed items within each area. This presentation slide effectively conveys information hierarchy in diverse speaking situations such as market analysis, regional strategy, and competitive comparison. The 2-slide set is ready for immediate use and editing.
Usage Points
-
Main Usage
Compare and analyze characteristics of multiple regions, markets, or competitors using an overlapping closed-form structure, visually expressing commonalities and differences across distinct areas.
-
How to Use
Enter region names, market names, or competitor names in each closed-form area, then fill internal item fields with characteristics, strengths, or weaknesses. The blue and green color-coded regions clearly distinguish categorical information for effective presentation delivery.
-
Recommended For
Marketing professionals, strategic planning teams, regional business managers, market analysis report writers, and executives preparing comparative analysis presentations will find this diagram ideal for systematically organizing and presenting regional or market-specific features.
-
Slide Structure
2-slide set featuring a 3-area overlapping closed-form cluster diagram on the first slide and an alternative layout variation on the second. Each region is color-coded in blue, green, and neutral tones with clearly marked text input areas for easy customization.
Related Products
-

Health Industry and Analysis Infographic Slide – Market Trends Visualization
#Market and Competitor Analysis #Diagram #Other
-

User Usage Status by Target Country – Market Analysis and Insights
#Market and Competitor Analysis #Diagram #Other
-

Export Strategy to Target Asian Countries
#Market and Competitor Analysis #Marketing Plan and Strategy #Diagram
-

Rocket Launch Progress by Country – Systematic Data Presentation
#Market and Competitor Analysis #Marketing Plan and Strategy #Diagram
