Brown Blue Simple Donut Graph
RJ0600007_6
- Last Update 06/22/2025
- File Size 2MB
- # of Slides 2
- File Format PPTX
- Slide Ratio 16:9
- Color
Keywords
About the Product
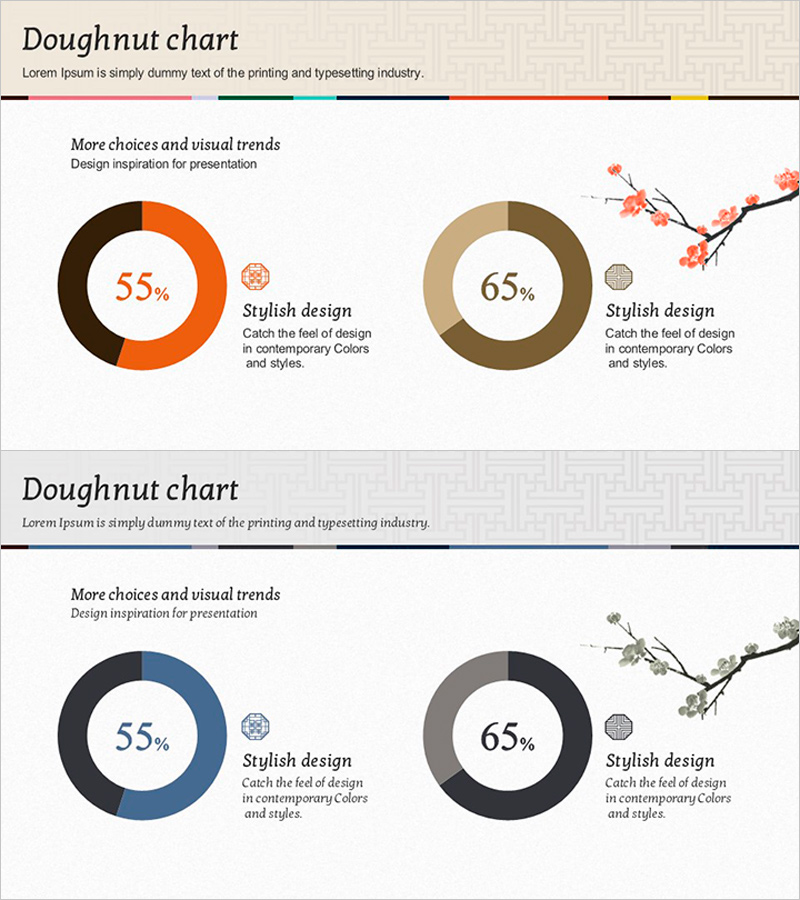
A 2-slide donut chart PowerPoint template featuring dual-tone brown and blue color scheme for intuitive data ratio visualization. Each slide displays two circular graphs side-by-side, optimized for comparative analysis of percentages and proportions. Perfect for marketing performance reports, customer satisfaction surveys, market share comparisons, and budget allocation presentations. The 16:9 widescreen format ensures compatibility with modern presentation environments, and the PPTX format allows immediate customization of data values and descriptions.
Usage Points
-
Main Usage
Specialized in visualizing proportional data and composition ratios through circular graph design. Ideal for marketing performance analysis, customer satisfaction metrics, market share distribution, budget allocation tracking, and comparative ratio analysis across time periods or categories. The dual-graph layout enables side-by-side comparison of related datasets.
-
How to Use
Replace percentage values in each donut chart with your actual data, and update the text descriptions in the right-side information boxes. Maintain the brown-blue color palette or customize with your corporate brand colors. The accompanying icons can be repositioned or replaced to match your presentation theme.
-
Recommended For
Marketing teams presenting campaign performance metrics, sales departments reporting quarterly results, executive management dashboards, consulting proposal data sections, and academic presentations of survey findings. Particularly effective when comparing two related data sets or showing before-after scenarios.
-
Slide Structure
Two donut charts per slide arranged horizontally. Each chart features a centered percentage value, right-aligned icon and text description area, and brown-blue dual-tone color differentiation. Title section at top and decorative color bar maintain visual consistency across the presentation.
Related Products
-

Purple Brown Market Share Analysis – Emphasizing Visual Appeal
#Market and Competitor Analysis #Graph #Other
-

Trends in Heavy Equipment Utilization – Market Analysis
#Business Introduction #Market and Competitor Analysis #Graph
-

Sports Future Expected Effects and Numerical Graphs
#Market and Competitor Analysis #Graph #Other
-

Customer Type Analysis Bar Graph – Data Visualization for Customer Success
#Company Introduction #Market and Competitor Analysis #Customer Success Stories
