Korean Traditional Design Diagram – Connection Elements
RJ0600006_9
- Last Update 06/22/2025
- File Size 3.7MB
- # of Slides 2
- File Format PPTX
- Slide Ratio 16:9
- Color
Keywords
About the Product
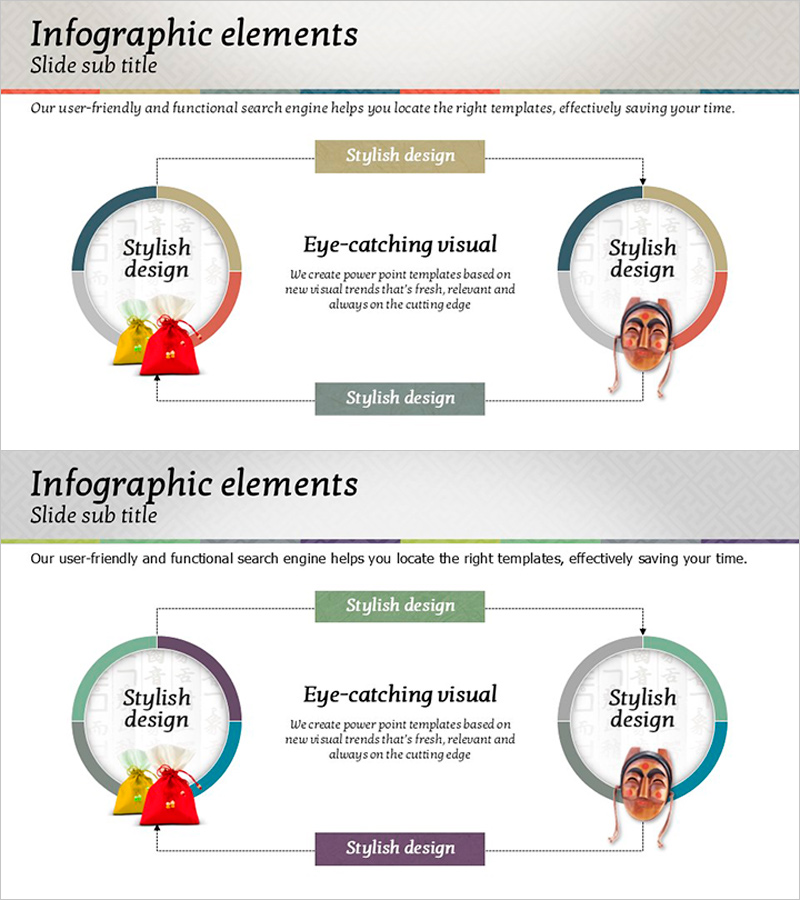
A circular connection diagram PowerPoint slide featuring Korean traditional color palette. The design expands from a central concept to two side nodes, visualizing bidirectional relationships. Dark blue, red, and beige tones combine with circular charts, directional arrows, and illustrative elements to create a cohesive visual structure. Text boxes and labels clearly identify each component. This 2-slide set is ready to use for organizational structures, system architecture, process flows, and interconnected concepts in business presentations.
Usage Points
-
Main Usage
Designed to visually represent organizational interconnections, system components, process flows, and bidirectional relationships. The symmetrical structure from center to left and right nodes emphasizes mutual influence and reciprocal connections between entities.
-
How to Use
Enter your core topic in the central text box and add connected items to the left and right circular nodes. Arrows and connecting lines indicate relationship direction, while color-coded labels help distinguish categories. Illustrative elements can be customized or removed to match your presentation context.
-
Recommended For
Ideal for organizational development, strategic planning, system design, and process improvement presentations. Effective for executives, planning teams, IT departments, and consultants explaining interconnected structures such as corporate culture, collaboration frameworks, supply chain networks, and cross-functional relationships.
-
Slide Structure
2-slide set. Each slide features a central concept with circular chart and two side nodes arranged symmetrically, connected by dotted arrows and label boxes. Title area at top and descriptive text area at bottom create clear information hierarchy.
Related Products
-

Flow Diagram for Traditional Cultural Industry System
#Technical Approach #Diagram #System Architecture Diagram
-

Global Network Service Configuration Diagram – Product Differentiation Strategy
#Product/Service Introduction #Technical Approach #Diagram
-

Camera Infographic – Contemporary Design Featuring Visual Trends
#Product/Service Introduction #Technical Approach #Diagram
-

System Infrastructure Structure Diagram Slide
#Business Introduction #Technical Approach #Diagram
