System Infrastructure Structure Diagram Slide
RJ0500011_7
- Last Update 06/10/2025
- File Size 4.1MB
- # of Slides 2
- File Format PPTX
- Slide Ratio 16:9
- Color
Keywords
- #Content-Based Slides
- #Design-Based Slides
- #Business Introduction
- #Technical Approach
- #Diagram
- #Infrastructure
- #System Architecture Diagram
- #Cluster
- #Spread
- #Chain Diagram
- #16:9
- #radial diagram PowerPoint
- #system infrastructure structure slide
- #network topology PowerPoint
- #infrastructure architecture diagram
- #IT system structure PPT slide
About the Product
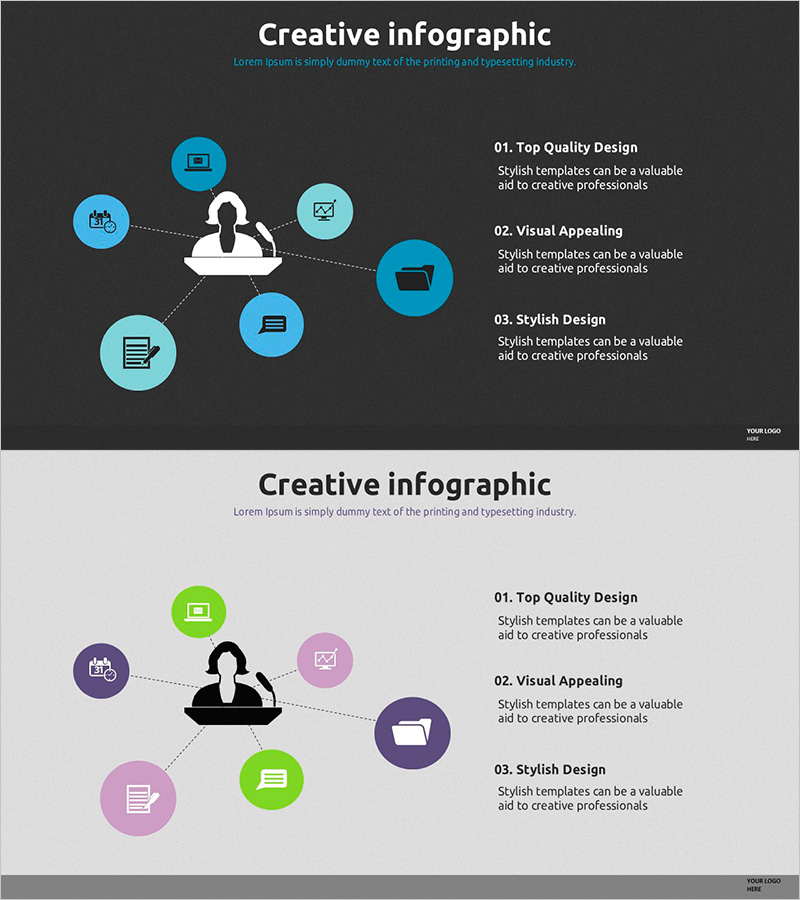
A radial infrastructure structure diagram PowerPoint slide with six key system elements radiating from a central hub. Features a dark background with light blue circular nodes connected by dotted lines, intuitively representing IT architecture and network topology. The 2-slide set includes both dark and light theme versions, with each node containing icons and editable text areas for immediate customization of system component names. Optimized for technical presentations, infrastructure design documents, and system architecture explanations.
Usage Points
-
Main Usage
Visualizes IT system architecture, network infrastructure, and cloud structures through a radial layout expanding from a central hub to surrounding elements. Each node represents an independent system component, with dotted connections illustrating relationships and data flow between systems.
-
How to Use
Use in technical presentations, system design meetings, infrastructure improvement proposals, and IT strategy reports to help stakeholders quickly understand complex system structures. Replace node text and icons with your organization's actual system names to create customized technical documentation.
-
Recommended For
IT architects, system engineers, network administrators, technology leaders, cloud solution specialists, and infrastructure team leads presenting system structures to technical stakeholders and executives.
-
Slide Structure
Central white hub icon surrounded by 6 light blue circular nodes connected via dotted lines. Each node includes an icon (laptop, building, monitor, folder, chat, server) and editable text area. Two versions provided: dark background and light background themes.
Related Products
-

Smart City Infrastructure Diagram – Innovative System Composition
#Business Introduction #Technical Approach #Diagram
-

Science Experimental Area Diffusion Diagram – Connecting Innovative Ideas
#Business Introduction #Diagram #Business Areas
-

Hexagon Connection Infographic – Technology and Service Composition
#Technical Approach #Diagram #Service Configuration Plan
-

IoT System Configuration Diagram – Innovation Through Connection
#Business Introduction #Technical Approach #Diagram
