Multidirectional Blue Orange Graph - Effective Data Flow Visualization
RJ0600004_18
- Last Update 06/22/2025
- File Size 16.1MB
- # of Slides 2
- File Format PPTX
- Slide Ratio 16:9
- Color
Keywords
- #Content-Based Slides
- #Design-Based Slides
- #Product/Service Introduction
- #Operational Plan
- #Diagram
- #Differentiation Strategy for Products/Services
- #Post-Implementation Management & Maintenance
- #Flow
- #Multidirectional Flow
- #16:9
- #multidirectional diagram PowerPoint
- #bidirectional flow slide template
- #process flow visualization PPT
- #interaction diagram presentation
- #data flow chart slide design
About the Product
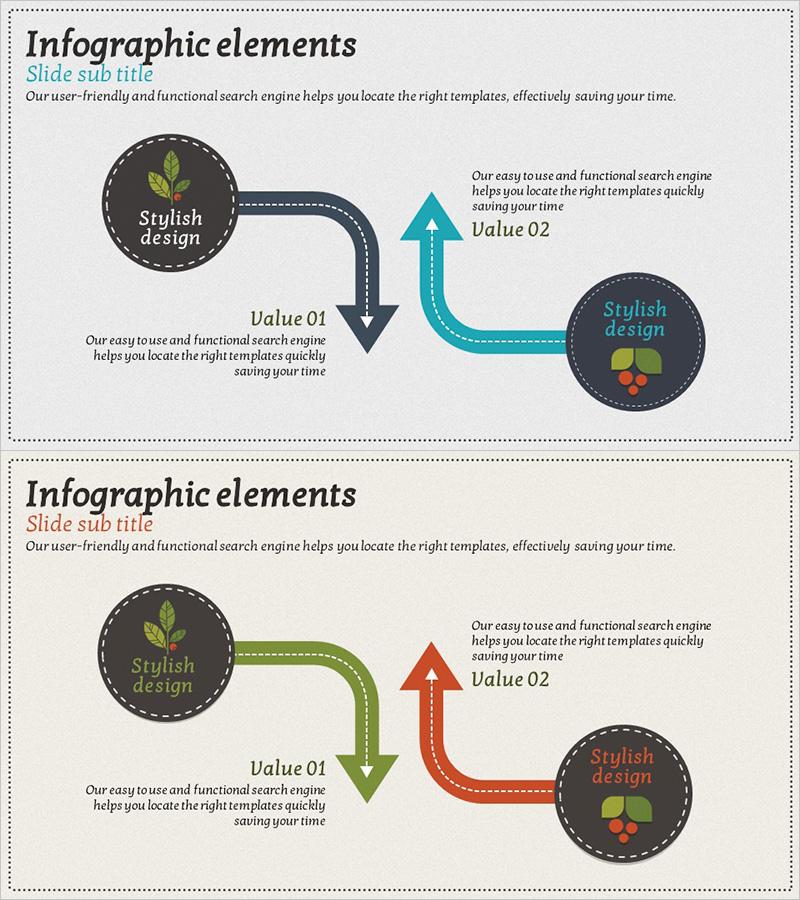
A bidirectional multidirectional flow diagram PowerPoint slide connecting two nodes with arrows in all directions. Dark gray circular nodes with icons are linked by blue and orange arrows representing upward, downward, left, and right flow. Dashed borders and right-angle paths clearly visualize process stages, interactions, and cyclical relationships, with text areas beside each node for explaining value propositions, operational plans, and product differentiation strategies. Available in 16:9 widescreen PPTX format, fully editable and ready to use.
Usage Points
-
Main Usage
Optimized for visualizing bidirectional process flows, interactions, and cyclical relationships. Ideal for operational planning presentations showing input-output stages, or product differentiation strategies illustrating customer feedback loops. Text areas beside each node clearly communicate key values and step-by-step explanations.
-
How to Use
Two-slide set with the first featuring blue and black arrows, the second offering green and orange arrow variations. Replace node icons and text to match your process, then modify arrow directions and labels to emphasize bidirectional relationships. Fully customizable in PowerPoint for your specific workflow.
-
Recommended For
Recommended for operations management, process improvement, and product development presentations. Effective in business plans for input-output flows, marketing plans for customer journey loops, and proposals for cross-functional collaboration structures. Suitable for any organizational presentation involving interdepartmental interactions.
-
Slide Structure
Two circular nodes (dark gray background with icons) connected by bidirectional arrows in all directions (up, down, left, right). Dashed borders and right-angle paths emphasize flow direction, with text input areas positioned beside each node. Both slides share identical structure with only color combinations varying for different presentation contexts.
Related Products
-

Medical Product Differentiation Strategy Diagram – Growth Through Information Sharing and Collaboration
#Product/Service Introduction #Diagram #Differentiation Strategy for Products/Services
-

Global Service Strategy Diagram – Innovative Operation Plan
#Product/Service Introduction #Operational Plan #Diagram
-

Physical Fitness Diagram Slide – Product and Service Introduction
#Product/Service Introduction #Business Management #Diagram
-

Emphasizing the Importance of Hydration with a Multidirectional Arrow Diagram
#Product/Service Introduction #Diagram #Text Box
