Trend and Status Analysis Slide – Blue Orange Diagram
RJ0600004_14
- Last Update 06/22/2025
- File Size 3.1MB
- # of Slides 2
- File Format PPTX
- Slide Ratio 16:9
- Color
Keywords
- #Content-Based Slides
- #Design-Based Slides
- #Business Management
- #Technical Approach
- #Diagram
- #Quality Assurance Plan
- #Research and Development
- #Cluster
- #Spread
- #Chain Diagram
- #Centralized Diagram
- #16:9
- #central circle diagram PowerPoint
- #radial diagram slide template
- #4-stage diagram presentation
- #trend analysis PowerPoint slide
- #status analysis slide design
- #how to create circle diagram in PowerPoint
About the Product
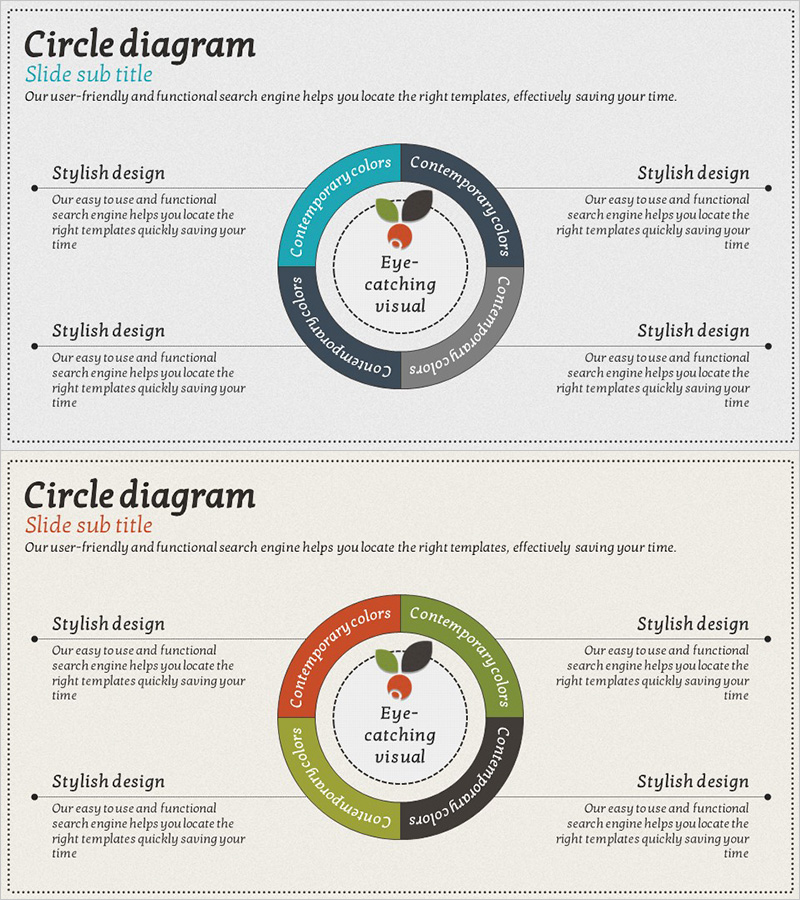
A radial circle diagram PowerPoint slide with a central core concept surrounded by four distinct segments in blue, orange, green, and gray. This design effectively visualizes multi-layered information such as trend analysis, status assessment, strategic planning, and organizational relationships. The central focal point emphasizes your key message while the four surrounding areas clearly show connections and dependencies. Includes 2 slide layouts with different color combinations, fully editable text and icons for immediate use in business presentations, planning documents, and executive reports.
Usage Points
-
Main Usage
Positions your core concept, organizational value, or strategic vision at the center while displaying four related dimensions (market, customer, competition, technology) in surrounding segments. Ideal for communicating multi-layered information in trend analysis, status reports, strategic planning, and organizational structure explanations.
-
How to Use
Enter your central message (e.g., Eye-catching visual) in the core circle, then populate the four outer segments with supporting details (Complementary colors, Contemporary design, Comprehensive, Customizable). Customize colors and text to match your corporate branding, then deploy in executive briefings, strategy presentations, and proposal pitches.
-
Recommended For
Recommended for executives, strategic planners, marketing teams, and business development professionals presenting organizational strategy, market analysis, or product positioning. Ideal for business plans, marketing strategies, investor pitch decks, organizational restructuring proposals, and any presentation requiring multi-dimensional information architecture.
-
Slide Structure
2-slide set. Each slide features a central circle (core message input area) surrounded by 4 outer segments (detail input areas) plus left and right text boxes for additional context. Slide 1 uses blue-orange-green-gray arrangement; Slide 2 uses orange-green-gray-blue arrangement, providing color flexibility for different presentation contexts.
Related Products
-

Diffusion Diagram of the Facility System
#Technical Approach #Diagram #Service Components
-

Chemical Reaction Mechanism Diagram – Intuitive Visualization through Service Structure
#Technical Approach #Diagram #Service Architecture Diagram
-

Triangular Connection Diffusion Diagram – Clear Presentation of Services
#Technical Approach #Diagram #Service Operation Plan
-

Real Estate Diffusion System – Innovative Cluster Diagram
#Business Strategy #Technical Approach #Diagram
