Colored Pencil Flow Diagram – Business Strategy and Operations Planning
RJ0500015_7
- Last Update 08/27/2025
- File Size 6.2MB
- # of Slides 2
- File Format PPTX
- Slide Ratio 16:9
- Color
Keywords
About the Product
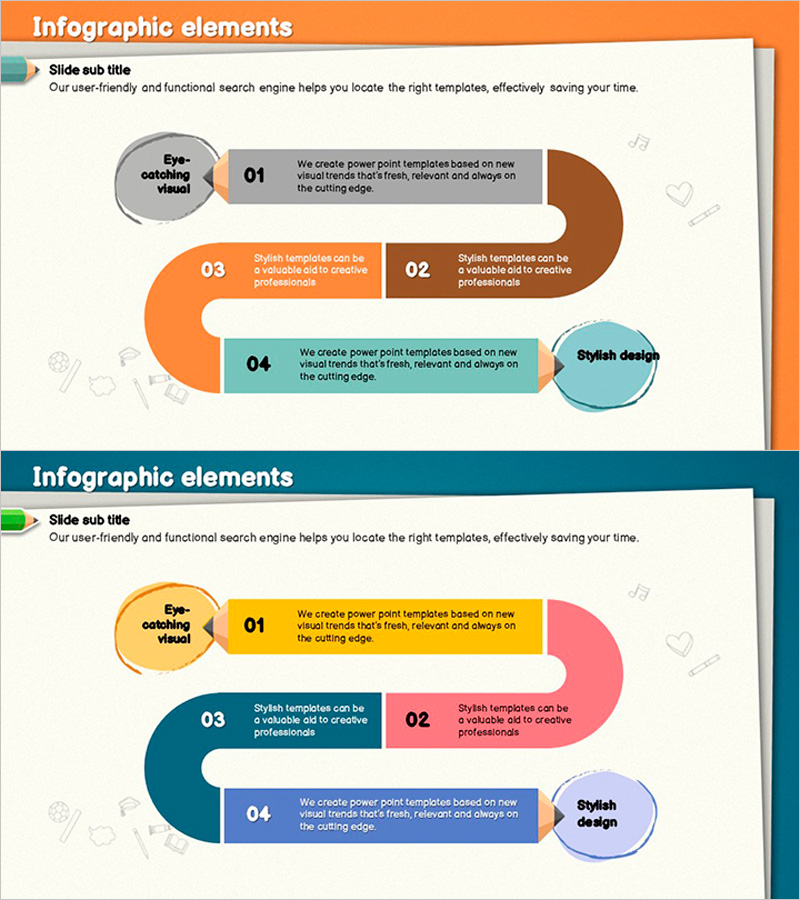
A 4-step flow diagram PowerPoint slide designed to visualize business progress and operational planning. This presentation slide features circular nodes connected to rectangular text boxes in a linear flow structure, clearly expressing each stage's key content. The warm and stable color combination of orange, brown, and teal is ideal for corporate presentations and strategy reports. With a 2-slide composition in 16:9 aspect ratio, it is ready for immediate editing and can be applied to various presentation materials including process flows, business stages, and project timelines.
Usage Points
-
Main Usage
Visualize business strategies, operational plans, work processes, and project schedules in stages to enhance audience comprehension. The combination of circular nodes and rectangular text boxes simultaneously conveys each stage's key content and connection relationships.
-
How to Use
Use in executive reports, strategy presentations, project kickoff meetings, and organizational restructuring briefings to explain sequential progression. Input stage-specific text and descriptions, and adjust colors as needed to customize the slide to match organizational culture or brand identity.
-
Recommended For
Ideal for executives, planning teams, project managers, marketing professionals, and consultants when establishing strategies, sharing progress updates, and creating decision-making materials. Particularly effective for internal organizational reporting and external presentations where stage-by-stage responsibilities, timelines, and deliverables must be clearly defined.
-
Slide Structure
2-slide composition featuring 4 circular nodes (left 'Eye-catching Visual', right 'Stylish Design') and 3 rectangular text boxes (steps 01-04) connected by arrows in a linear flow structure on each slide. The first slide uses orange, brown, and teal colors, while the second uses yellow, pink, and blue to accommodate diverse presentation contexts.
Related Products
-

Sports Illustration and Connection Diagram – Motivational Theme
#Business Strategy #Operational Plan #Diagram
-

Connection Diagram: Key Elements of Speech Concept
#Business Strategy #Operational Plan #Diagram
-

Progress Process Diagram for Business Strategy
#Business Strategy #Operational Plan #Diagram
-

Camping Business Work Process Diagram – Connected Steps
#Business Strategy #Operational Plan #Diagram
