Circular Process Diagram – Visuals with Contemporary Design
RJ0600001_19
- Last Update 06/21/2025
- File Size 0.1MB
- # of Slides 2
- File Format PPTX
- Slide Ratio 16:9
- Color
Keywords
About the Product
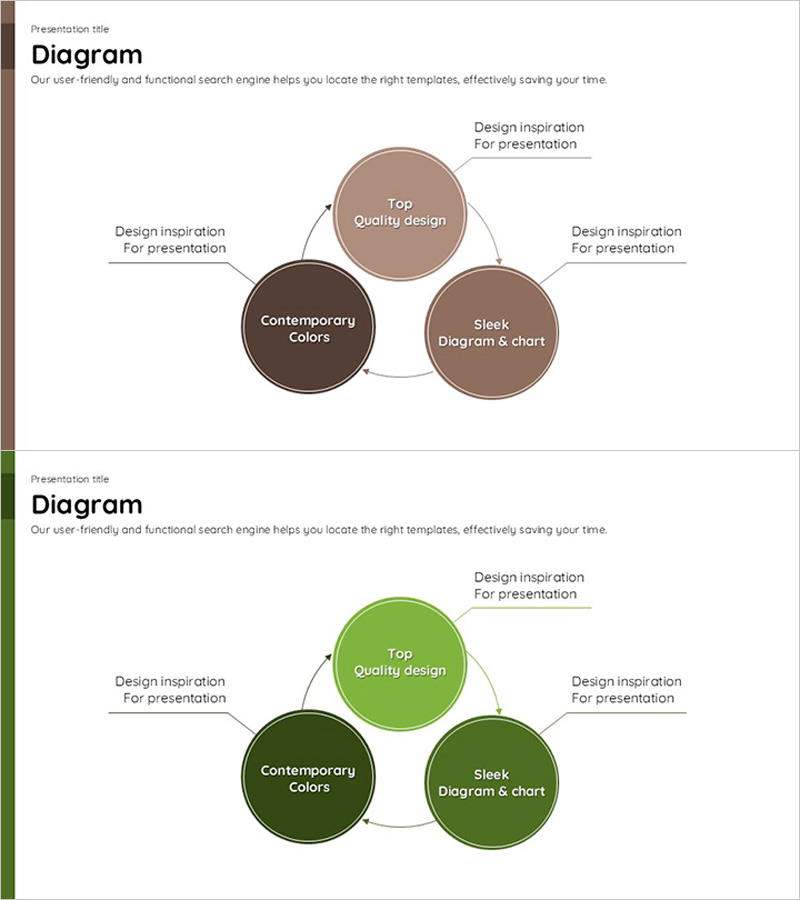
A circular process diagram PowerPoint slide featuring three nodes connected by directional arrows in a continuous cycle. Available in two color versions: warm brown and vibrant green tones. Each node includes editable title and description text areas, with additional callout text boxes positioned around the diagram for supplementary information. Ideal for visualizing business processes, operational cycles, continuous improvement loops, and workflow stages. The 16:9 widescreen format includes 2 slides ready for immediate use in presentations, business plans, reports, and strategic documents.
Usage Points
-
Main Usage
Visualizes business processes, operational cycles, continuous improvement loops, and multi-stage workflows using a clear 3-node circular structure. Emphasizes cyclical relationships and sequential progression through directional arrows connecting each phase.
-
How to Use
Replace node titles with your process stage names and add detailed descriptions in the text areas. Use the callout boxes to highlight key points or additional context. Select the color version that matches your presentation theme or brand identity. Customize text formatting and colors as needed.
-
Recommended For
Strategy and planning sections for business process flows, operations teams explaining work cycles, quality management presenting improvement methodologies, marketing teams outlining campaign stages, and project management teams describing iterative processes.
-
Slide Structure
2-slide set with identical layouts. Each slide displays 3 circular nodes arranged in a triangular pattern with curved arrows creating a clockwise cycle. Title and description text fields are embedded within each node. Three callout text boxes with pointer lines are positioned at top, left, and right for additional annotations.
Related Products
-

Linear Flow Diagram of Business Strategy – Innovative Technology and Future Direction
#Business Strategy #Technical Approach #Diagram
-

Analysis of Sales Growth Segments Slide
#Technical Approach #Market and Competitor Analysis #Diagram
-

Introducing the Business Program for Success – Diagram for Effective Presentation
#Product/Service Introduction #Business Vision and Strategy #Diagram
-

Business Process Procedure Diagram – Effective Business Management
#Business Management #Operational Plan #Diagram
