Diagram for Detailed Analysis - Highlighting Information Connectivity
RJ0600001_13
- Last Update 08/21/2025
- File Size 0.1MB
- # of Slides 2
- File Format PPTX
- Slide Ratio 16:9
- Color
Keywords
- #Content-Based Slides
- #Design-Based Slides
- #Technical Approach
- #Diagram
- #Service Components
- #Service Configuration Plan
- #Spread
- #Radial Diagram
- #16:9
- #radial diagram PowerPoint
- #information connection slide template
- #business analysis diagram
- #6-item diagram PPT
- #diagram slide design
- #how to create radial diagram in PowerPoint
About the Product
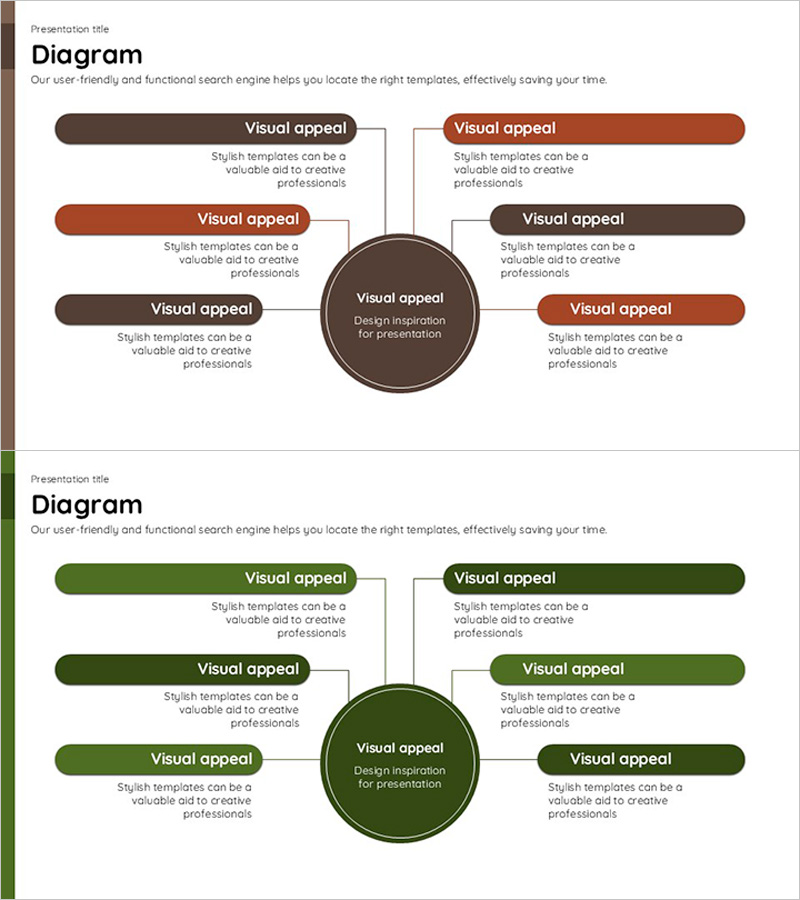
A radial diagram PowerPoint slide with six branches extending from a central concept in all directions. Designed with a two-tone brown and rust color scheme, each item includes a dedicated text description area. This presentation template effectively visualizes the connectivity between a core concept and related elements in business analysis, service composition, and detailed analysis materials. The 2-slide set offers color variations in brown and green palettes, delivered in 16:9 widescreen PPTX format for immediate editing and customization.
Usage Points
-
Main Usage
Positions a core concept at the center and connects six related items radiating outward to clearly express relationships and connectivity between information elements. Enables systematic visualization of multi-layered data in business analysis, service component explanations, and detailed analysis presentations.
-
How to Use
Enter your main concept or key topic in the central circular node, then add related items and descriptions in the six directional text boxes. Customize item colors or add icons to distinguish categories, and apply animations to match your presentation flow and timing.
-
Recommended For
Ideal for executive reports, strategic planning presentations, service portfolio introductions, organizational structure explanations, project scope definitions, and marketing analysis materials. Valuable for consultants, planners, analysts, and marketing professionals who need to communicate complex information clearly and concisely.
-
Slide Structure
2-slide set featuring the same radial structure in brown and green color variations. Each slide contains one central circular node with six directional item boxes, each providing dedicated title and description text areas. Optimized for 16:9 widescreen format to suit modern presentation environments and display systems.
Related Products
-

Social Network Platform Service Configuration – Centralized Radial Diagram
#Product/Service Introduction #Technical Approach #Diagram
-

Creative Diagram Slide for How to Use Flour
#Product/Service Introduction #Technical Approach #Diagram
-

Feature Breakdown of a Social Media Platform – Innovation and Accessibility
#Product/Service Introduction #Technical Approach #Diagram
-

Stylish Infographic Slide Design – Contemporary Colors and Quality
#Technical Approach #Marketing Plan and Strategy #Diagram
