Seagull and SWOT Analysis – Elegant Design for Strategic Insights
RJ0500046_21
- Last Update 06/20/2025
- File Size 0.2MB
- # of Slides 2
- File Format PPTX
- Slide Ratio 16:9
- Color
Keywords
About the Product
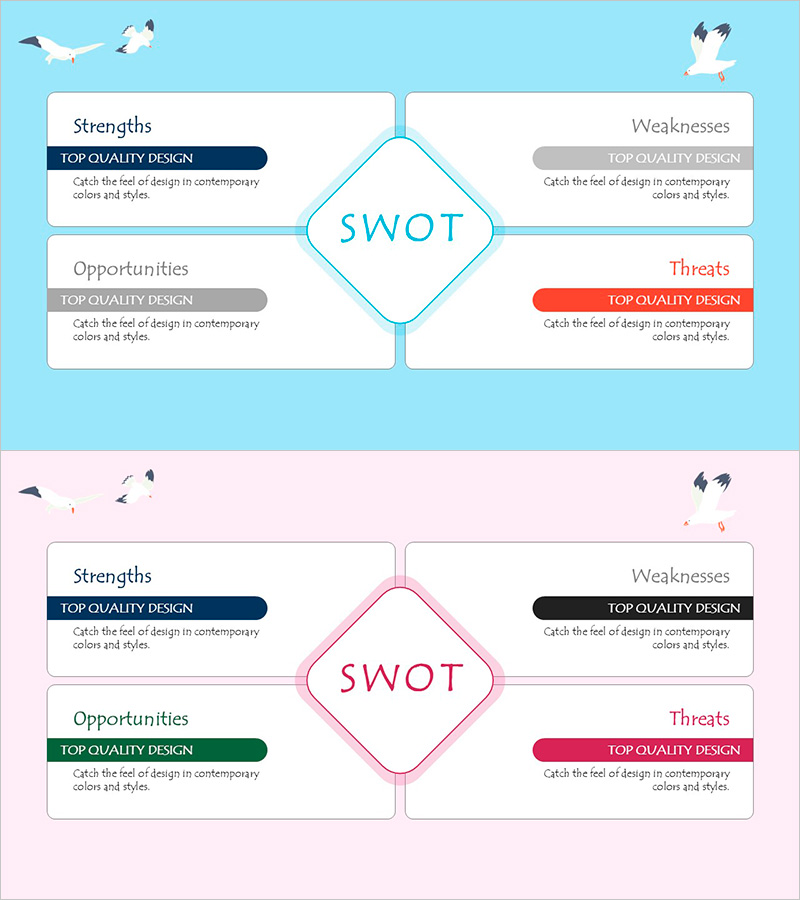
A 2-slide PowerPoint template featuring a 4-quadrant SWOT analysis diagram with a central diamond node radiating to Strengths, Weaknesses, Opportunities, and Threats sections. The design includes two color variations: a blue-toned version and a pink-toned version, each with dedicated text input boxes and color-coded labels for each quadrant. Seagull illustrations are positioned in the background to add visual interest and movement to your presentation. Formatted in 16:9 widescreen PPTX, fully editable and ready for immediate use in business strategy presentations, executive reports, and strategic planning sessions.
Usage Points
-
Main Usage
Designed for corporate strategy analysis and executive decision-making presentations. The 4-quadrant structure clearly separates strengths, weaknesses, opportunities, and threats, enabling effective visual communication of strategic insights. Ideal for board presentations, strategic planning meetings, and business development discussions.
-
How to Use
Enter your analysis content into the four quadrants surrounding the central SWOT node. Customize the text boxes with specific strengths, weaknesses, opportunities, and threats relevant to your analysis. Choose between the blue or pink color scheme to match your organization's branding. All elements are fully editable in PowerPoint.
-
Recommended For
Recommended for executives, strategy managers, marketing planners, business development teams, and management consultants. Perfect for new market entry assessments, competitive analysis, organizational capability evaluations, marketing strategy development, and corporate strategic planning presentations.
-
Slide Structure
2-slide set: Slide 1 features a blue-toned background with a central diamond SWOT node and four quadrant input areas (top-left: Strengths, top-right: Weaknesses, bottom-left: Opportunities, bottom-right: Threats). Slide 2 mirrors the structure with a pink-toned background. Both slides include seagull illustrations positioned in the corners.
Related Products
-

Closure Diagram of History – Capturing Business Milestones
#Company Introduction #Diagram #History
-

Diagram Introducing Business Activity Areas – Visualizing Business Areas
#Company Introduction #Business Introduction #Diagram
-

Introduction to Food Trucks – Modern Diagram Utilization
#Product/Service Introduction #Diagram #Product/Service Introduction
-

Market Trend Analysis Graph & Table Chart
#Market and Competitor Analysis #Diagram #Graph
