Orange Red Diffusion Diagram – Business Area and Operations Plan
RJ0500046_13
- Last Update 06/20/2025
- File Size 0.1MB
- # of Slides 2
- File Format PPTX
- Slide Ratio 16:9
- Color
Keywords
- #Content-Based Slides
- #Design-Based Slides
- #Business Introduction
- #Operational Plan
- #Diagram
- #Business Areas
- #Production and Technology Development Strategy
- #Spread
- #Decentralized Diagram
- #16:9
- #diffusion diagram PowerPoint
- #4-directional diagram slide
- #radial diagram template
- #business area diagram
- #operational plan PowerPoint slide
About the Product
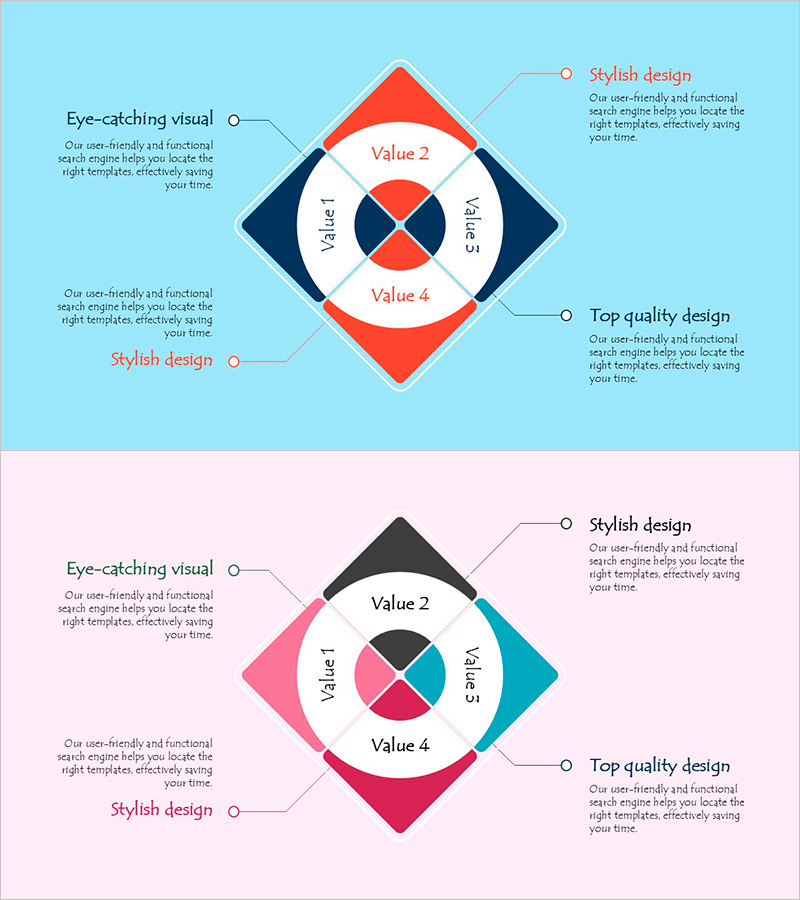
A PowerPoint slide featuring a radial diffusion diagram with a central pie chart expanding into four directional zones. The design combines orange-red and navy tones to create strong visual contrast, with Value 1–4 labels positioned in each direction for representing business areas, operational plans, and strategic elements. The diamond-shaped outer frame and callout annotations enable layered information presentation, making it ideal for complex business presentations. Two-slide set includes color variations (blue tone and pink-turquoise tone) to match your document's color scheme and branding requirements.
Usage Points
-
Main Usage
Visualizes four key elements—business areas, operational components, strategic directions, or organizational functions—radiating from a central concept. The central pie chart anchors the core idea while four directional zones display supporting details, creating a hierarchical information structure that guides audience understanding.
-
How to Use
Edit the central pie chart's colors and text to input your core concept. Replace Value 1–4 labels with actual item names. Add explanatory text to the callout annotations for each directional zone. Select the appropriate color tone to align with your presentation's brand identity and visual guidelines.
-
Recommended For
Business plans, organizational structure presentations, strategic planning sessions, operational reports, marketing strategy pitches, and new business proposals. Effective for executive briefings, team meetings, and client presentations where complex multi-element concepts require hierarchical explanation.
-
Slide Structure
Two-slide set. Each slide features a central four-segment pie chart as the anchor point, with a diamond-shaped outer frame extending into four directional zones (top, bottom, left, right). Each zone contains a Value label and callout annotation. Slide 1 uses orange-red and navy tones; Slide 2 provides pink and turquoise color variation for flexible design application.
Related Products
-

Visualizing Business Areas with Square Diffusion Diagram
#Business Introduction #Operational Plan #Diagram
-

Rainbow Paper Presentation Template Infographic Elements
#Business Introduction #Operational Plan #Diagram
-

Soft Power Sector Diagram – Optimized for Business Introduction
#Company Introduction #Business Introduction #Diagram
-

Service Configuration Diagram Camping Icon
#Business Introduction #Technical Approach #Diagram
