Visualizing Business Areas with Square Diffusion Diagram
RJ0900029_13
- Last Update 08/24/2025
- File Size 1.3MB
- # of Slides 2
- File Format PPTX
- Slide Ratio 16:9
- Color
Keywords
- #Content-Based Slides
- #Design-Based Slides
- #Business Introduction
- #Operational Plan
- #Diagram
- #Business Areas
- #Production and Technology Development Strategy
- #Cluster
- #Spread
- #Closed Cluster Diagram
- #Decentralized Diagram
- #16:9
- #square diffusion diagram
- #4-box diagram PowerPoint
- #business areas visualization
- #cluster diagram slide
- #how to create diffusion diagram in PowerPoint
About the Product
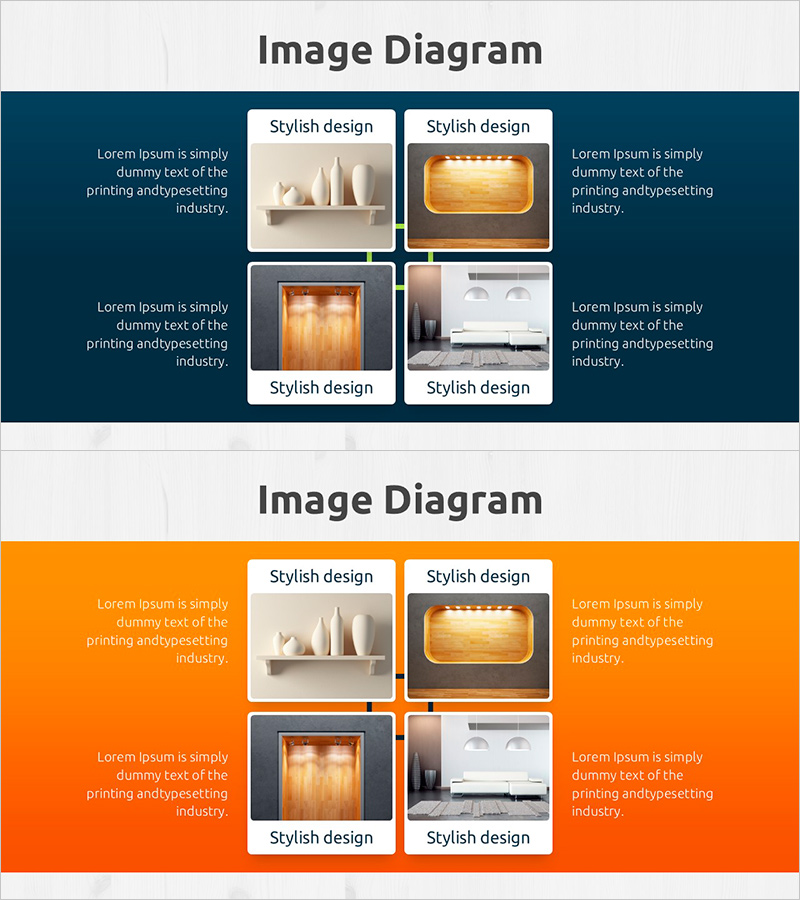
A square diffusion diagram PowerPoint slide that visualizes business areas, organizational structures, and strategic elements using four distinct boxes. The design features a dark blue background with white-bordered boxes and warm-toned image areas in orange and beige, creating clear information hierarchy. Left and right text zones allow detailed descriptions of each element, making it ideal for company overview, business introduction, and operational planning sections. The 2-slide set offers versatile color combinations (dark blue and orange versions) optimized for 16:9 widescreen format. Each box accommodates images and text freely, enabling immediate integration into presentation materials.
Usage Points
-
Main Usage
Presents four key items—business areas, organizational departments, strategic elements, or core functions—with equal visual weight and comparative clarity. Each square box maintains independence while demonstrating its role within the overall structure, making it effective for portfolio presentations and multi-faceted approach explanations.
-
How to Use
Insert images into each square box and add descriptive text in the left and right text zones. Apply this slide in company overview sections covering business areas, business plan documents detailing operational strategies, and proposal presentations explaining solution components. Customize color combinations to align with brand identity guidelines.
-
Recommended For
Recommended for executives explaining business divisions, HR professionals introducing organizational structures, marketing teams presenting product lineups, consultants analyzing strategic frameworks, and educators explaining core educational program modules.
-
Slide Structure
2-slide set featuring dark blue background and orange background versions. Each slide contains a 2×2 grid of four square boxes (with integrated image areas) centered on the slide, flanked by left and right text zones. Optimized for 16:9 widescreen format with fully editable elements throughout.
Related Products
-

SNS Business Circular Diagram - A Symbol of Collaboration and Growth
#Company Introduction #Business Introduction #Diagram
-

Geoscience Target Strategy - Utilizing Cluster and Diffusion Diagrams
#Product/Service Introduction #Business Introduction #Diagram
-

Orange Red Diffusion Diagram – Business Area and Operations Plan
#Business Introduction #Operational Plan #Diagram
-

Business Areas and Strategies - Cluster Diagram
#Business Introduction #Business Vision and Strategy #Diagram
