Detailed Analysis Charts for Learning Areas – Effective Tool for Market Analysis
RJ0500036_24
- Last Update 06/16/2025
- File Size 1MB
- # of Slides 2
- File Format PPTX
- Slide Ratio 16:9
- Color
Keywords
- #Content-Based Slides
- #Design-Based Slides
- #Market and Competitor Analysis
- #Marketing Plan and Strategy
- #Diagram
- #Graph
- #Customer Analysis
- #Key Marketing Activities
- #Spread
- #Other
- #Centralized Diagram
- #Radar Chart Spider Chart
- #16:9
- #radial diagram PowerPoint
- #6-item analysis slide
- #PowerPoint radial chart
- #learning area analysis PPT
- #marketing strategy diagram
- #PowerPoint slide template
About the Product
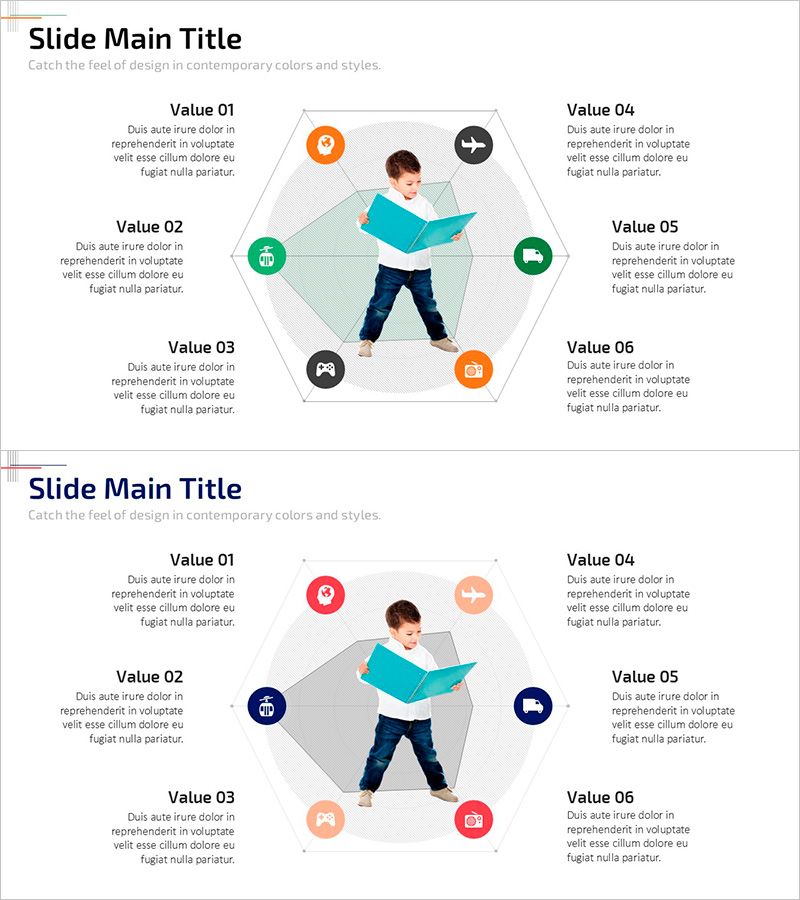
A PowerPoint slide featuring a radial diagram structure with six items radiating from a central point. Orange, green, and black icons visually distinguish each item, while a central human illustration emphasizes the learning and analysis theme. The 2-slide set includes a color variation of the same layout, allowing you to select the version that best fits your presentation context. This design is highly effective for business presentations where you need to explain core concepts through six different perspectives, such as marketing strategy, market analysis, and learning area assessment. Provided in 16:9 widescreen PPTX format for immediate editing.
Usage Points
-
Main Usage
Clearly express hierarchical relationships and radiating structures by positioning six related elements around a central theme. Effectively communicate the interconnectedness of surrounding elements in learning area analysis, marketing strategy development, market analysis, and business model explanation.
-
How to Use
Enter your central theme, then add analysis content to each of the six items. Edit the icons and text in each section to customize the slide according to your presentation context. Choose between the two color versions to adjust the tone of your presentation materials.
-
Recommended For
Marketing professionals, strategic planners, educators, consultants, and analysts who need to systematically explain complex elements. Ideal for business plans, marketing proposals, pitch decks, and educational seminar materials where analysis results require visual representation.
-
Slide Structure
2-slide set. Each slide features a radial layout with a central human illustration and theme text, surrounded by six items arranged in a circular pattern. The first slide uses multi-color icons in orange, green, and black; the second provides a color variation with red, blue, and orange tones.
Related Products
-

Finding Common Ground Through Team Activities – Effective Customer Analysis Template
#Market and Competitor Analysis #Marketing Plan and Strategy #Text Box
-

Campus Learning and Growing Moments – Customer Analysis and Marketing Strategy
#Market and Competitor Analysis #Marketing Plan and Strategy #Diagram
-

Cogwheel-Based Collaboration & Communication Framework
#Marketing Plan and Strategy #Diagram #Marketing Strategy
-

Customized Analysis Strategy by Audience Type – Secrets of Market-Driven Marketing
#Market and Competitor Analysis #Marketing Plan and Strategy #Diagram
