Marketing Business Connection Diagram – Strategy for Business Success
RJ0500036_22
- Last Update 06/16/2025
- File Size 0.5MB
- # of Slides 2
- File Format PPTX
- Slide Ratio 16:9
- Color
Keywords
- #Content-Based Slides
- #Design-Based Slides
- #Business Strategy
- #Operational Plan
- #Diagram
- #Production and Technology Development Strategy
- #Cluster
- #Chain Diagram
- #Project Progress
- #16:9
- #circular diagram PowerPoint slide
- #4-step connection diagram
- #business process flow PPT
- #marketing strategy diagram
- #business cycle slide template
About the Product
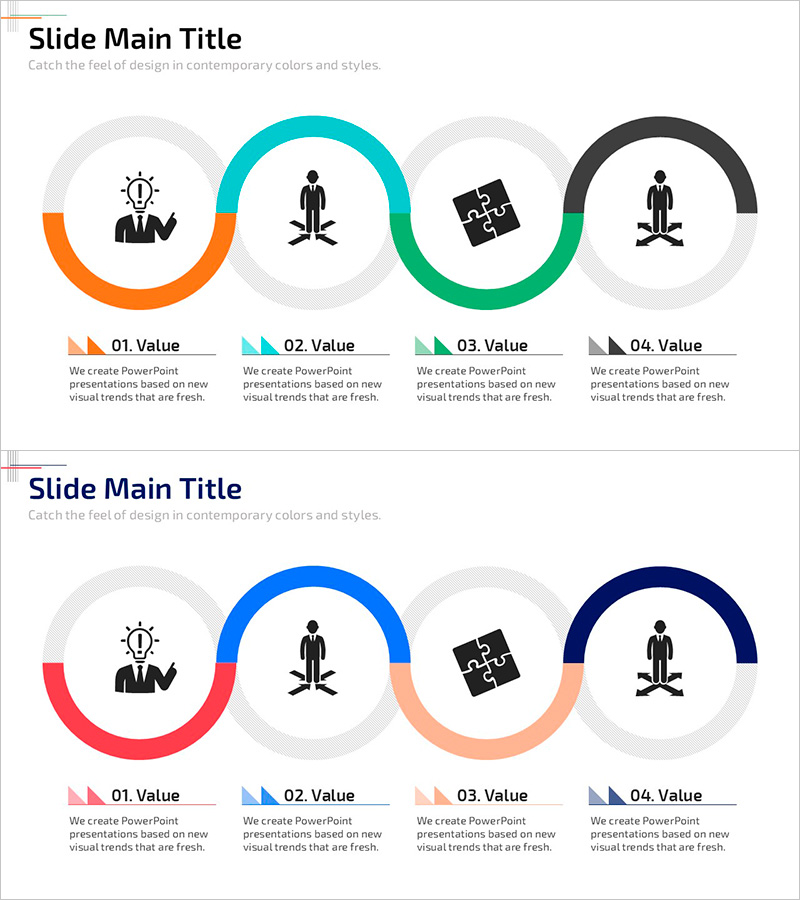
A 4-step circular connection diagram PowerPoint slide that visualizes business progress and marketing strategy. The arc-shaped connectors in orange, teal, green, and black create a cyclical flow structure, with icons and text areas positioned at each stage to clearly communicate value propositions, key elements, and interconnected relationships. The 2-slide set offers two layout variations with different color combinations, allowing you to select the design that best fits your presentation context. This slide template is ideal for business plans, operational roadmaps, marketing strategy decks, and other professional presentations where you need to illustrate process flows and phased implementation strategies effectively.
Usage Points
-
Main Usage
Illustrates the phased flow of business progress and the cyclical nature of marketing strategy through visual design. Four interconnected nodes arranged in a circular pattern clearly convey process continuity and mutual relationships, while emphasizing the core value and objectives at each stage.
-
How to Use
Used by executives, marketing teams, and business managers to explain quarterly business plans, marketing campaign phases, product development processes, and customer journey maps. Insert stage names, objectives, responsible parties, and timelines into each arc section to enhance team-wide understanding and alignment.
-
Recommended For
Ideal for business plans, marketing strategy documents, quarterly reports, strategic presentations, and operational roadmaps where process flow explanation is needed. Particularly effective for expressing cyclical concepts such as continuous improvement, PDCA cycles, and customer experience loops.
-
Slide Structure
2-slide set. Each slide features 4 arc-shaped nodes arranged in circular formation. The first slide uses orange, teal, green, and black; the second uses red, blue, orange, and navy. Each node includes an icon area in the center and text input area at the bottom, allowing simultaneous expression of 4 key values, objectives, or strategies.
Related Products
-

Farm Service Diagram – Operational Strategies and Technical Approaches
#Operational Plan #Technical Approach #Diagram
-

Ribbon Flow Diagram of Core Processes
#Business Strategy #Diagram #Business Direction
-

The Detailed Football Strategy Slide – Competitive Operation Plan
#Product/Service Introduction #Operational Plan #Diagram
-

Business Support Plan for Agricultural Development – Cluster Diagram
#Business Strategy #Operational Plan #Diagram
