Ribbon Flow Diagram of Core Processes
RB0800013_19
- Last Update 03/20/2025
- File Size 7.1MB
- # of Slides 2
- File Format PPTX
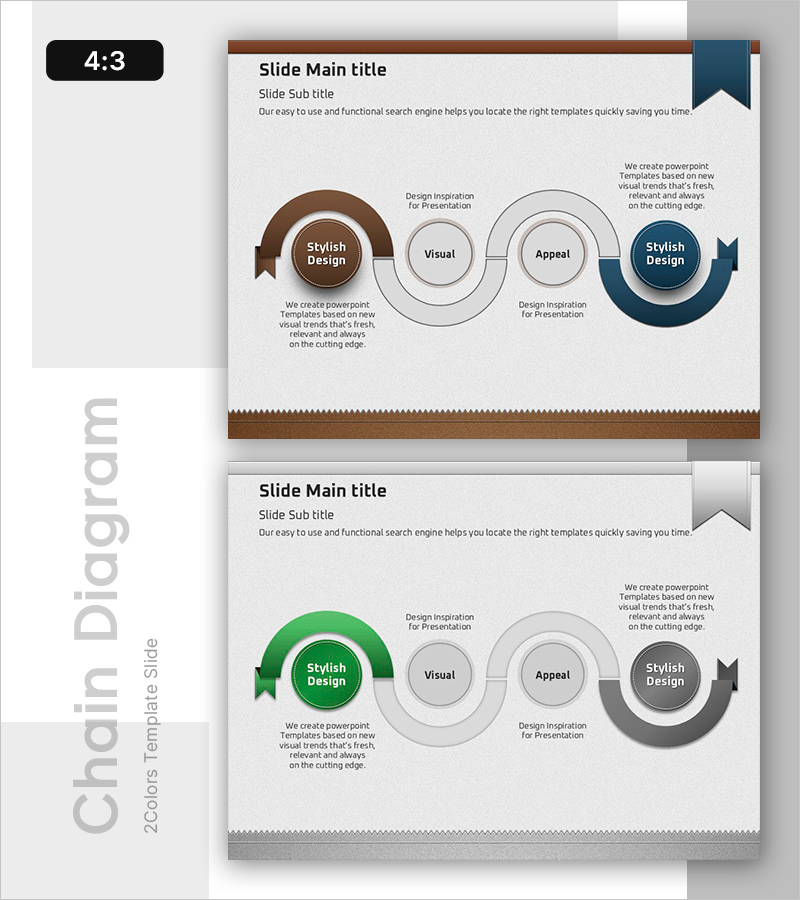
- Slide Ratio 4:3
- Color
Keywords
About the Product
A 4-stage ribbon-style cycle diagram PowerPoint slide designed to visualize business progression and core processes. Available in three color versions—brown, green, and gray—each combining ribbon banners with circular nodes for each stage. The flow begins with a left-side brown ribbon, progresses through central Visual and Appeal stages with gray circular nodes, and concludes with a dark blue ribbon on the right, expressing both linear progression and cyclical structure. Each node includes a text area below for detailed stage descriptions. Delivered as an editable PPTX file in 4:3 aspect ratio with 2 slides.
Usage Points
-
Main Usage
Illustrates business strategy stages in a cyclical structure, emphasizing process continuity and repetition. The combination of ribbon banners and circular nodes visually distinguishes each stage's importance, while text areas enable clear communication of stage-specific details, objectives, and execution plans.
-
How to Use
Enter stage names in the center of each circular node and add stage descriptions, goals, and action items in the text areas below. Select a color version matching your corporate brand or assign different colors to each stage for enhanced distinction. Ideal for business plans, strategy presentations, and executive briefings.
-
Recommended For
Business strategy and planning teams presenting implementation timelines and stage-specific objectives. Executive presentations and investor pitches showcasing business progress. Organizational process improvement and operational planning communications. Suitable for manufacturing, construction, IT, and financial sectors requiring stage-based project management.
-
Slide Structure
2-slide set. Slide 1: Brown ribbon start → gray circular nodes (Visual, Appeal) → dark blue ribbon end in 4-stage cycle. Slide 2: Green ribbon version with identical structure. Four text input areas below each node, additional description space in left and right ribbon banners.
Related Products
-

Weather Flow Direction Diagram – Business Strategy Presentation
#Business Strategy #Diagram #Business Direction
-

Logistics Process Flow Chart Visualization Slide
#Business Strategy #Diagram #Business Direction
-

Journey to a Goal Slide – Emphasizing Business Strategy
#Business Vision and Strategy #Business Strategy #Diagram
-

Witch and Stage Guide Flow – Business Strategy Diagram
#Business Strategy #Diagram #Text Box
