System Configuration Chart – Visualizing Future Development in Technology Sector
RJ0500035_26
- Last Update 06/16/2025
- File Size 0.4MB
- # of Slides 2
- File Format PPTX
- Slide Ratio 16:9
- Color
Keywords
- #Content-Based Slides
- #Design-Based Slides
- #Technical Approach
- #Diagram
- #Future Development Roadmap
- #Research and Development
- #Flow
- #16:9
- #system configuration diagram PowerPoint slide
- #technology architecture slide
- #left-right comparison diagram
- #system structure visualization
- #how to create system architecture in PowerPoint
About the Product
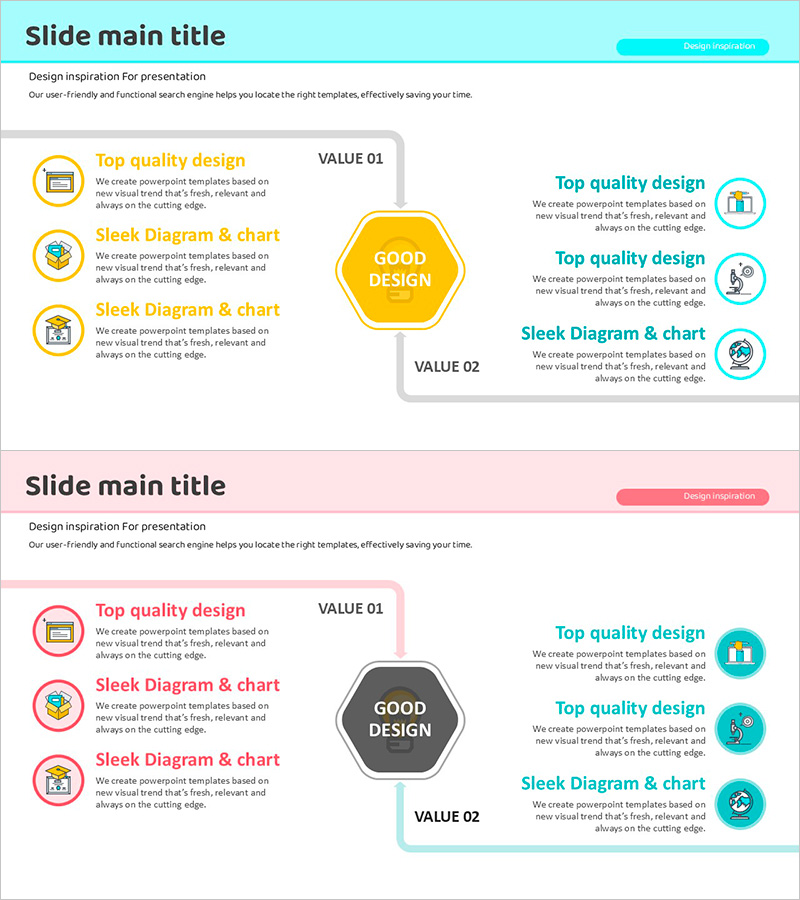
A 2-slide PowerPoint presentation that visualizes technology sector system architecture through a symmetrical comparison layout. The left side features a yellow circular center element with three icon-based items representing VALUE 01, while the right side displays three cyan-colored circular icons for VALUE 02. Each section combines title, descriptive text, and icons to create a layered information hierarchy that makes complex technical structures intuitive and accessible. Available in 16:9 widescreen PPTX format for immediate editing and customization in research presentations, technology roadmaps, and system architecture discussions.
Usage Points
-
Main Usage
Transforms complex technology system structures into a clear left-right comparative visual format, enabling executives and technical teams to quickly grasp architectural concepts. Perfect for R&D strategy presentations, technology roadmaps, system modernization proposals, and innovation technology adoption discussions.
-
How to Use
Input current system state or existing technology stack in the left VALUE 01 section, and target state or new technology in the right VALUE 02 section. Add technology names, features, and benefits in the text boxes next to each icon to create a comprehensive comparative analysis document.
-
Recommended For
Technology managers, R&D teams, IT architects, and system engineers presenting technology strategies, system improvements, and innovation initiatives. Highly effective for executive briefings, investor presentations, and technical seminars where complex structures need to be simplified and clearly communicated.
-
Slide Structure
Two-slide deck with each slide divided into title area and central comparison zone. Symmetrical layout features left side with 3 icon items, central circular emphasis element, and right side with 3 icon items. Total of 7 editable text areas: 1 title, 3 left descriptions, and 3 right descriptions.
Related Products
-

Multidirectional Orange Graph – Product and Service Introduction
#Product/Service Introduction #Technical Approach #Diagram
-

Maple Leaf Arrow Future Plans Slide
#Operational Plan #Technical Approach #Diagram
-

Advances in Science by Year Slide
#Technical Approach #Diagram #Future Development Roadmap
-

Unity Strategy for Victory – Visualizing Marketing Flow
#Technical Approach #Marketing Plan and Strategy #Diagram
