Step-by-Step Propulsion Schedule Diagram – Visualizing Business Strategy
RJ0500035_16
- Last Update 06/16/2025
- File Size 0.3MB
- # of Slides 2
- File Format PPTX
- Slide Ratio 16:9
- Color
Keywords
- #Content-Based Slides
- #Design-Based Slides
- #Business Strategy
- #Operational Plan
- #Diagram
- #Step-by-Step Schedule Plan
- #Project Implementation Schedule
- #Table
- #Standard Table
- #16:9
- #4-step timeline diagram PowerPoint
- #business strategy roadmap slide
- #project timeline template
- #step-by-step process diagram
- #how to create timeline in PowerPoint
About the Product
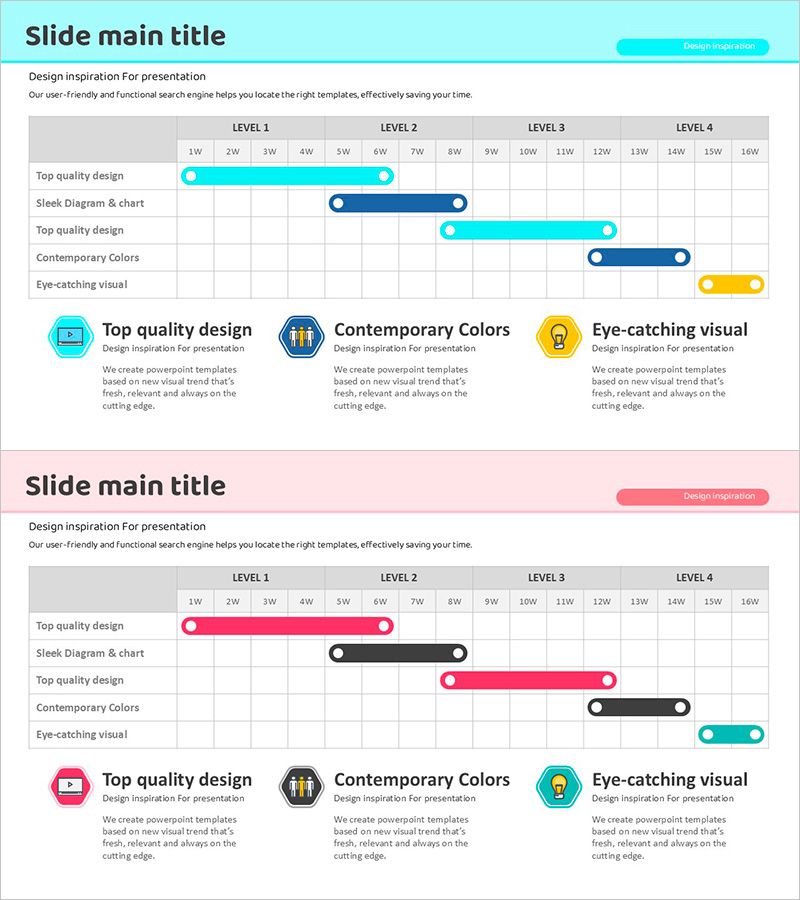
A 4-step timeline diagram PowerPoint slide that visualizes your business strategy and project roadmap. This presentation template uses cyan and dark gray nodes connected in a linear sequence to clearly show progression through each phase. The slide design effectively communicates project milestones, implementation schedules, and strategic phases in your business proposal or pitch deck. Includes 2 slides with fully editable text fields for each stage, allowing you to customize timelines and descriptions to match your specific project needs.
Usage Points
-
Main Usage
Clearly visualize business strategy phases and project timelines to help audiences understand the progression and duration of each implementation stage. The linear diagram format makes complex schedules easy to comprehend at a glance.
-
How to Use
Insert this slide into business plans, strategy presentations, project proposals, or investor pitch decks. Edit the text fields under each node to add specific dates, milestones, or phase names. Adjust colors to highlight priority phases or different project tracks.
-
Recommended For
Ideal for executives, project managers, business strategists, management consultants, and marketing professionals presenting implementation plans. Perfect for investor presentations, board meetings, and client proposals requiring clear timeline visualization.
-
Slide Structure
Two-slide set featuring a horizontal 4-node timeline layout. Each node is represented by a cyan or dark gray circle connected by lines, with text input areas below for stage descriptions. The left-to-right flow emphasizes sequential progression through project phases.
Related Products
-

Science Experiment Record Table – Research and Experiment Management
#Business Strategy #Operational Plan #Diagram
-

Diagrams for Construction Schedule System – Methodical Operation Plan
#Business Strategy #Business Management #Operational Plan
-

Curved Theme Purple Template Schedule – Efficient Operational Planning
#Business Management #Operational Plan #Diagram
-

Presentation Calendar – Two Versions
#Business Management #Operational Plan #Diagram
