Science Experiment Record Table – Research and Experiment Management
RJ0400025_18
- Last Update 05/24/2025
- File Size 3.3MB
- # of Slides 2
- File Format PPTX
- Slide Ratio 16:9
- Color
Keywords
- #Content-Based Slides
- #Design-Based Slides
- #Business Strategy
- #Operational Plan
- #Diagram
- #Step-by-Step Schedule Plan
- #Project Implementation Schedule
- #Table
- #Standard Table
- #16:9
- #table diagram PowerPoint
- #data table slide template
- #experiment record table
- #research management template
- #4-row table PowerPoint slide
About the Product
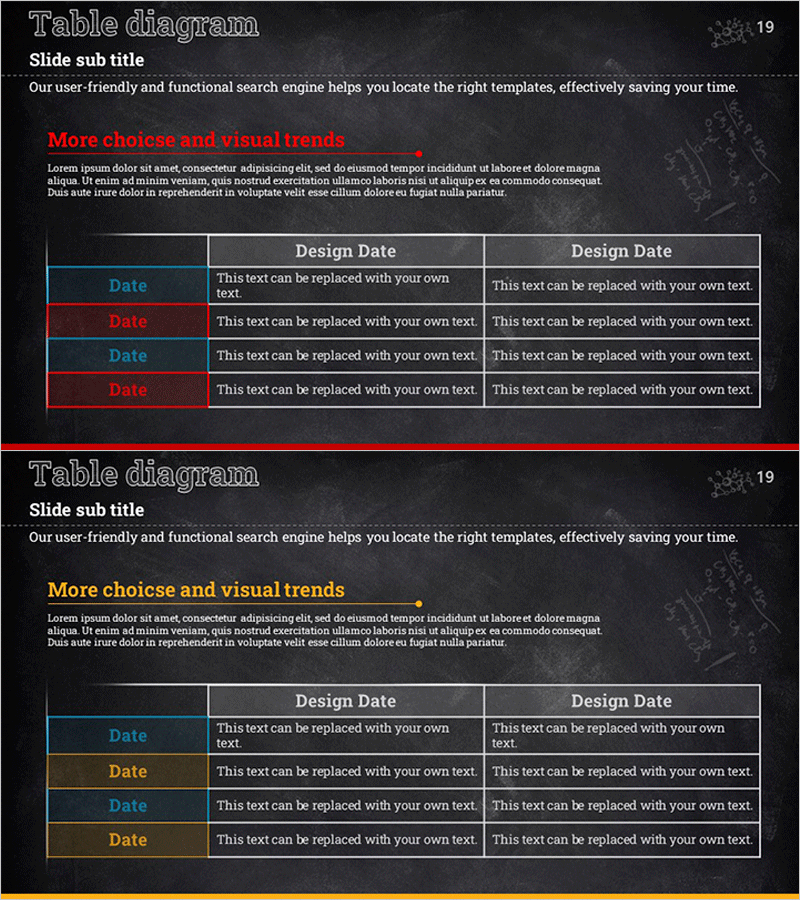
A 4-row data table PowerPoint slide designed for organizing scientific experiment records and research data systematically. Built on a dark gray background with blue and red accent rows, this 3-column structure allows input of dates, descriptions, and additional information in each row. Ideal for experiment management, operational planning, and phase-by-phase schedule tracking in presentations. The slide deck consists of 2 slides optimized for 16:9 widescreen format, making it perfect for research institutions, laboratories, and project management presentations.
Usage Points
-
Main Usage
Organize and present experiment results, research data, operational plans, and phase-by-phase schedules in table format. The date column and description column in each row enable chronological recording and management of information.
-
How to Use
Enter dates, experiment details, results, or progress status in each row. Use the blue and red accent rows as differentiation markers to indicate priority levels or categories. Fill the additional information column with details such as responsible person, status, or remarks.
-
Recommended For
Ideal for research scientists, laboratory managers, project managers, educational institution instructors, and quality assurance specialists who need to track data records and project progress in presentations.
-
Slide Structure
Consists of 2 slides, each featuring a 4-row × 3-column table structure. The first row serves as a header (Design Date), while rows 2-4 alternate between blue, red, blue, and red for visual distinction. Formatted in 16:9 widescreen PPTX.
Related Products
-

Step-by-Step Propulsion Schedule Diagram – Visualizing Business Strategy
#Business Strategy #Operational Plan #Diagram
-

Diagrams for Construction Schedule System – Methodical Operation Plan
#Business Strategy #Business Management #Operational Plan
-

Business Promotion Schedule Slide – A Roadmap for Efficient Operations
#Business Strategy #Operational Plan #Diagram
-

Smoking Cessation Progress Analysis Table Diagram – Example of Business Strategy Execution
#Business Strategy #Diagram #Step-by-Step Schedule Plan
