Question Mark Connection Diagram - Visualizing Business Strategy
RJ0500029_21
- Last Update 06/15/2025
- File Size 0.3MB
- # of Slides 2
- File Format PPTX
- Slide Ratio 16:9
- Color
Keywords
About the Product
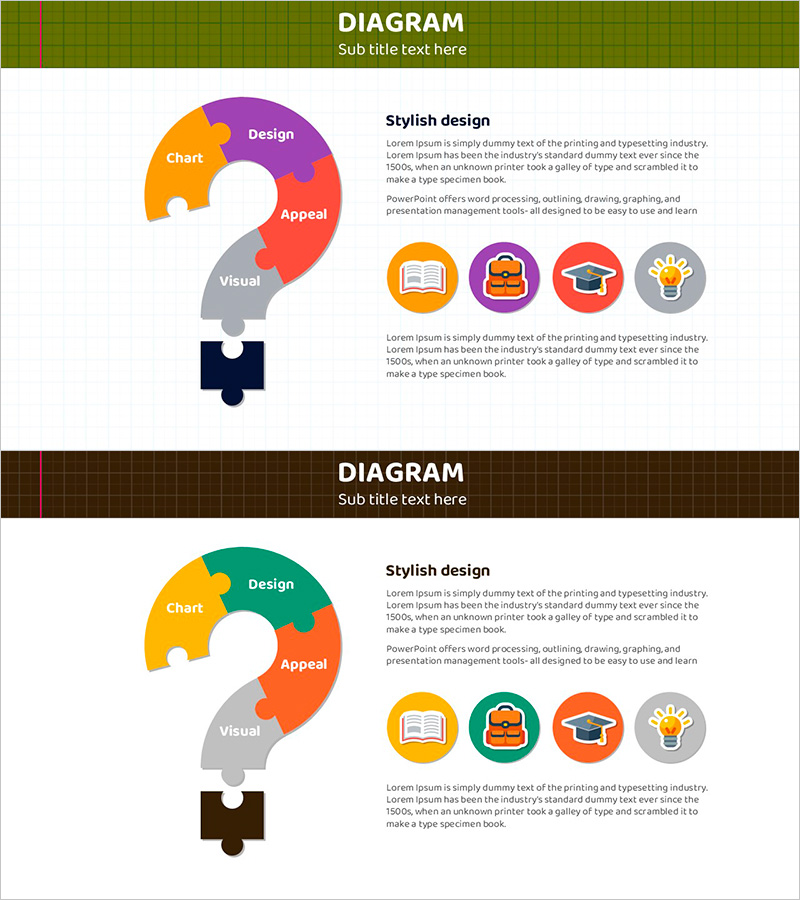
A question mark connection diagram PowerPoint slide designed to visualize business strategy and decision-making processes. The central question mark node branches into four directions, making it ideal for organizing diverse answers, strategies, and options related to a core question. Four distinct areas—Design, Chart, Appeal, and Visual—are color-coded for clear information hierarchy, with icons (book, briefcase, graduation cap, lightbulb) reinforcing categorical meaning. This 16:9 widescreen 2-slide deck integrates seamlessly into strategy presentations, planning documents, and executive reports.
Usage Points
-
Main Usage
Clarifies decision-making processes by organizing diverse perspectives, strategies, and options into four color-coded areas branching from a central question. Transforms complex strategic concepts into intuitive visuals for executive briefings, planning sessions, and business strategy presentations.
-
How to Use
Enter your core question in the central question mark node, then populate the four diverging areas (Design, Chart, Appeal, Visual) with corresponding answers, strategies, or action plans. Color coding and icons are pre-applied—simply edit text content. Nodes and colors can be customized as needed.
-
Recommended For
Executives, strategists, marketing teams, consultants, and educators. Ideal for business strategy development, project planning, decision analysis, problem-solving frameworks, and cross-functional team meetings. Particularly effective when addressing 'why' questions requiring multi-faceted answers.
-
Slide Structure
2-slide deck. Each slide features a central question mark node with four-directional diverging branches forming a cluster diagram. Nodes are color-differentiated (orange, purple, red, gray) with accompanying icons (book, briefcase, cap, lightbulb) to reinforce categorical meaning. 16:9 widescreen format optimized for projector display and online presentations.
Related Products
-

Study Results Connection Diagram – Visualizing Business Strategies
#Business Strategy #Diagram #Implementation Framework
-

Fire Extinguisher Diagram – Visualizing Business Strategy
#Business Strategy #Operational Plan #Diagram
-

Rotating Arrow Diagram – Business Strategy and Operations Planning
#Business Strategy #Operational Plan #Diagram
-

Flower-shaped Cross Graphics for Business Vision and Strategy
#Business Vision and Strategy #Business Strategy #Diagram
