Study Results Connection Diagram – Visualizing Business Strategies
RJ0500038_28
- Last Update 06/17/2025
- File Size 0.4MB
- # of Slides 2
- File Format PPTX
- Slide Ratio 16:9
- Color
Keywords
- #Content-Based Slides
- #Design-Based Slides
- #Business Strategy
- #Diagram
- #Implementation Framework
- #Flow
- #Cluster
- #Multidirectional Flow
- #Chain Diagram
- #16:9
- #connection diagram PowerPoint
- #4-node diagram slide
- #process flow PowerPoint template
- #business strategy visualization slide
- #diagram slide template download
About the Product
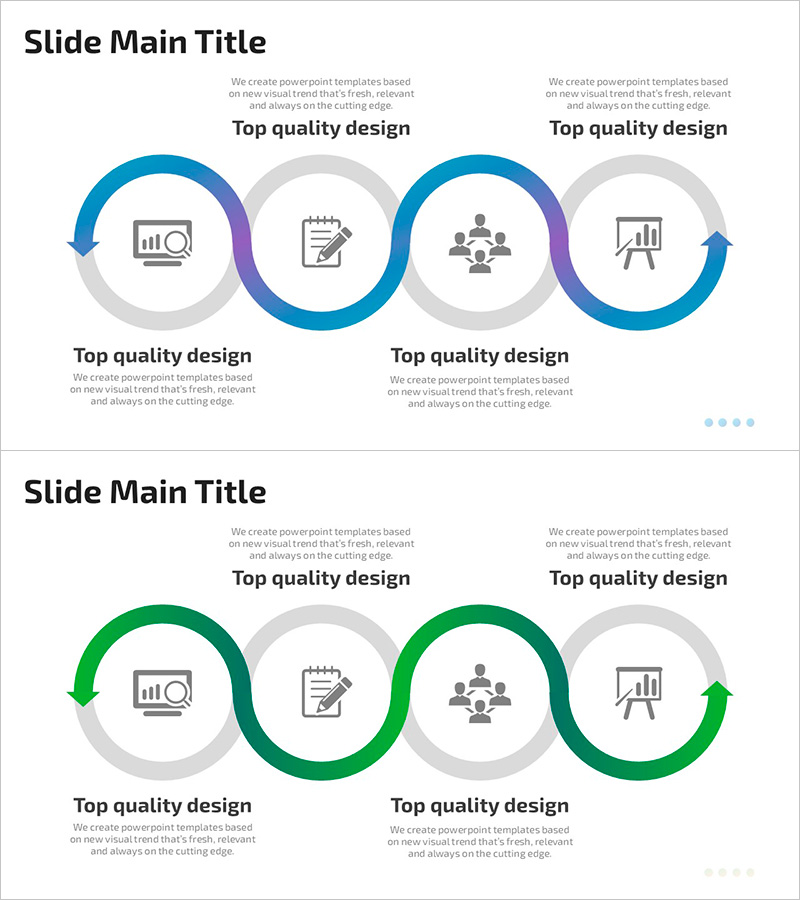
A 4-node connection diagram PowerPoint slide that visualizes research outcomes and business strategy initiatives. Blue-to-purple gradient arrows connect four circular nodes, each containing icon placeholders and text areas for customization. The 2-slide set includes both blue and green color variants, allowing you to match your presentation theme and corporate branding. Delivered in 16:9 widescreen PPTX format, fully editable and ready to use. Ideal for expressing process flows, sequential steps, and interconnected relationships with clarity and visual impact.
Usage Points
-
Main Usage
Represents research findings, business initiatives, process stages, and interconnected relationships using four distinct nodes connected by directional arrows. The bidirectional flow emphasizes mutual influence and collaborative relationships between departments, strategies, or outcomes.
-
How to Use
Insert department names, strategic pillars, outcomes, or objectives into each node's text area. Customize icons to match your content. Arrow direction and color can indicate process sequence or priority levels. Use in executive briefings, strategy presentations, and research reports to highlight how key elements connect and influence each other.
-
Recommended For
Executives, planning teams, research departments, and marketing professionals presenting strategy frameworks, project progress, organizational structures, or cross-functional collaboration. Effective for business plans, strategic reports, research presentations, and organizational restructuring announcements.
-
Slide Structure
Four circular nodes connected by blue-to-purple gradient arrows in a balanced, flowing layout. Each node includes an icon placeholder and text input area. The 2-slide template provides identical structure in both blue and green color schemes for flexible branding options.
Related Products
-

Fire Extinguisher Diagram – Visualizing Business Strategy
#Business Strategy #Operational Plan #Diagram
-

Step-by-step Schedule Plan Farming Icon - Green Purple
#Business Strategy #Diagram #Step-by-Step Schedule Plan
-

Preparation Procedure for the Wedding Hall – Roadmap for Weddings
#Business Strategy #Operational Plan #Diagram
-

Connecting Diagram for Weight-Loss Program Course Enhancement
#Business Strategy #Business Management #Diagram
