U.S. Map and People Analysis – Infographic for Market and Competitor Analysis
RJ0500022_13
- Last Update 06/13/2025
- File Size 3.8MB
- # of Slides 2
- File Format PPTX
- Slide Ratio 16:9
- Color
Keywords
- #Content-Based Slides
- #Design-Based Slides
- #Operational Plan
- #Market and Competitor Analysis
- #Other
- #Organizational Structure and Staffing Plan
- #Target Market
- #Map
- #16:9
- #USA map PowerPoint slide
- #map infographic presentation
- #market analysis map slide
- #competitor analysis PPT
- #regional analysis template
About the Product
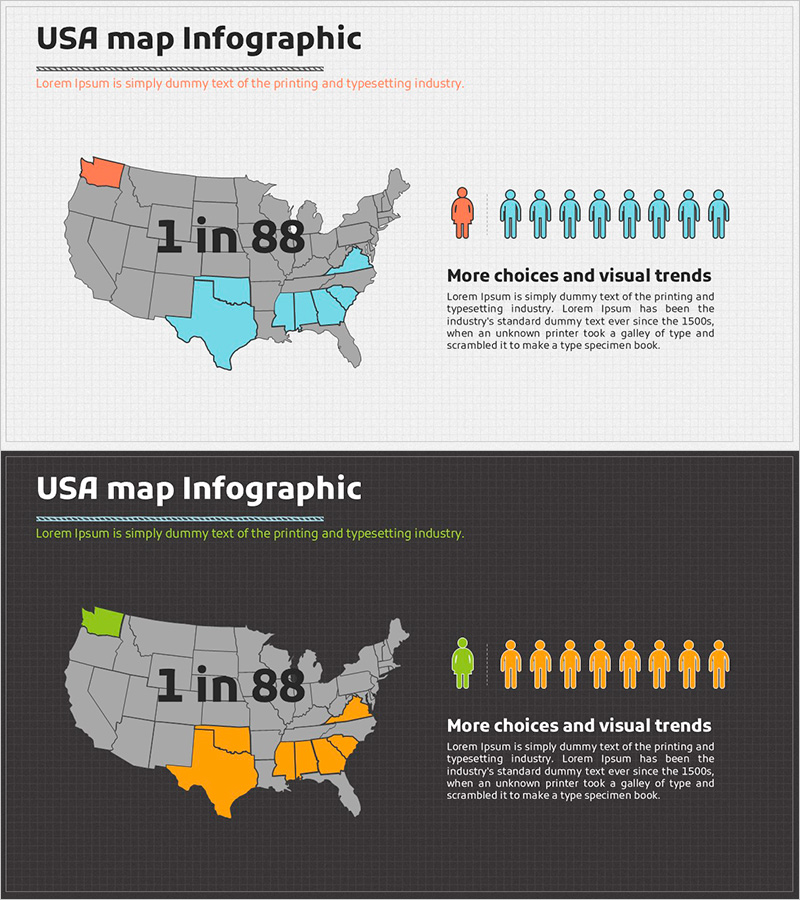
A geography-based infographic PowerPoint slide that visualizes regional market conditions and population distribution across the United States at a glance. Provided in two design versions—light background (gray and cyan) and dark background (black and orange)—allowing you to match your presentation tone. Each slide features a USA map with highlighted regions in color, accompanied by population statistics icons and text areas on the right side, ready for immediate use in market analysis, competitor analysis, and regional strategy planning. Delivered in 16:9 widescreen PPTX format compatible with all presentation environments.
Usage Points
-
Main Usage
Visualizes regional market conditions, population distribution, and competitor positioning across the USA using map-based graphics to support decision-making. An essential slide for investor presentations, market entry strategies, and regional marketing planning that delivers data-driven insights.
-
How to Use
Highlight target regions on the map using color coding, then input market size, population, market share, or other regional data in the text area on the right. Apply the light background version to bright-toned presentations and the dark background to premium-styled materials for consistent visual branding throughout your deck.
-
Recommended For
Marketing managers, business development teams, investor relations specialists, and executives preparing market analysis reports will find this slide ideal for explaining market conditions, regional strategies, and competitive positioning. Particularly effective for USA market entry presentations, regional sales strategy discussions, and market share comparison reports.
-
Slide Structure
Two-slide layout with each slide containing a title area at the top, USA map in the center with color-highlighted regions, and population statistics icons (9 human figures) plus text input area on the right. Designed as a comparison layout where 1–2 regions are highlighted on the map and corresponding analysis content is entered on the right side.
Related Products
-

Setting Target Country Goals – Market & Competitor Analysis
#Market and Competitor Analysis #Marketing Plan and Strategy #Other
-

Customer Analysis by Country Slide – Market Trends and Insights
#Market and Competitor Analysis #Graph #Other
-

City Map & Population Density Insights Slide – Market and Competitive Analysis
#Market and Competitor Analysis #Graph #Other
-

European Target Market Analysis Table – Foundation for Marketing Strategy
#Market and Competitor Analysis #Marketing Plan and Strategy #Diagram
