Learning Illustration Schedule – Linear Flow and Data Visualization
RJ0500022_12
- Last Update 06/13/2025
- File Size 3.7MB
- # of Slides 2
- File Format PPTX
- Slide Ratio 16:9
- Color
Keywords
- #Content-Based Slides
- #Design-Based Slides
- #Business Strategy
- #Operational Plan
- #Diagram
- #Roadmap
- #Project Implementation Schedule
- #Flow
- #Table
- #Linear Flow
- #Standard Table
- #16:9
- #schedule table PowerPoint
- #project timeline slide
- #horizontal bar chart presentation
- #task management PPT
- #weekly schedule template
About the Product
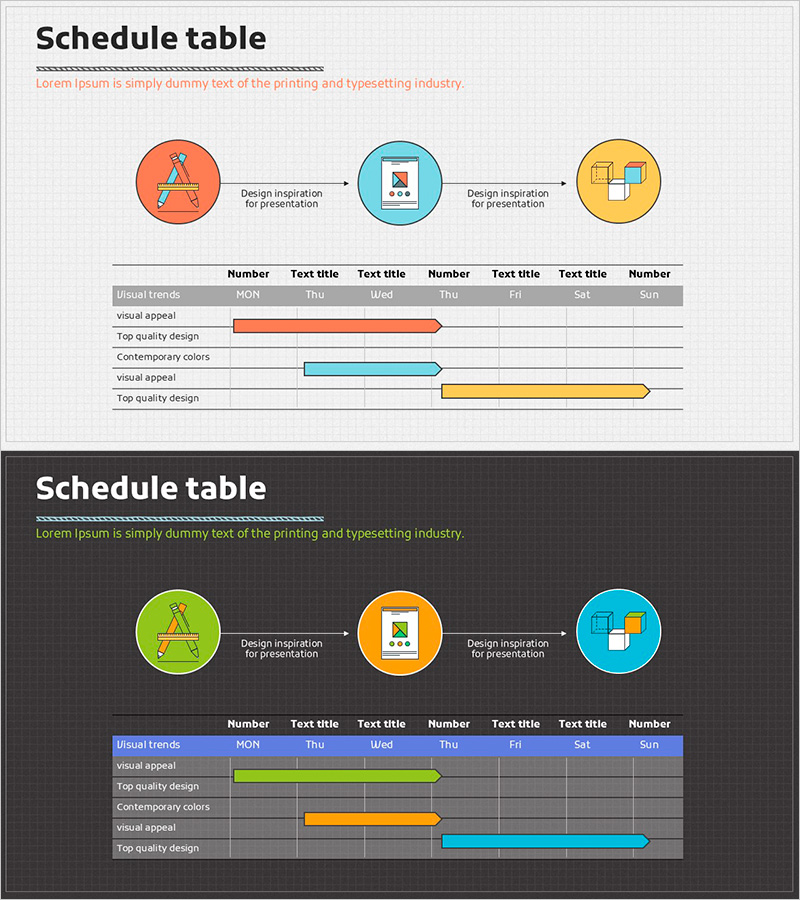
A horizontal bar schedule table PowerPoint slide that visually manages project timelines and learning progress. Three circular icons at the top represent sequential process stages, while the bottom section displays a horizontal bar chart tracking daily schedules. Three distinct colors—orange, blue, and yellow—differentiate each item's progress status for intuitive communication. This presentation slide is ready to use immediately for business operations, project management, learning schedules, and various professional presentations.
Usage Points
-
Main Usage
Visualize project schedules, learning progress, and work timelines on a time-based axis to share status updates with team members and increase transparency in schedule management. The combination of top-level process flow and bottom-level detailed schedule communicates both overall context and specific milestones simultaneously.
-
How to Use
Enter stage names (planning, execution, completion, etc.) in the three circular icons at the top, then modify the table item names and bar lengths to match your actual project schedule. Colors can be changed by priority or team member assignment, and the day headers can be adjusted for weekly or monthly views.
-
Recommended For
Project managers, team leads, training coordinators, and marketing planners benefit from using this slide for weekly status reports, learning schedule sharing, and milestone tracking presentations. It is particularly effective when comparing parallel tasks across a timeline.
-
Slide Structure
Top section: 3 circular nodes (orange, blue, yellow) connected by arrows in linear process flow / Bottom section: 7-column (days) × 5-row (items) table structure with 3 horizontal bars positioned across rows. Each bar represents a time period through its start point and length, with row background colors distinguishing items.
Related Products
-

Milestone Schedule Slide – Linear Flow for Business Strategy
#Business Strategy #Operational Plan #Diagram
-

Geometric Pattern Wide PPT Table – Business Strategy and Operations Plan
#Business Strategy #Operational Plan #Diagram
-

Business Idea Service Roadmap – Business Strategy
#Business Strategy #Operational Plan #Diagram
-

Horizontal Timeline Slide – Year-by-Year Business Roadmap
#Company Introduction #Business Strategy #Business Management
