Performers and Infographic Elements – Visualization of Music
RJ0500020_11
- Last Update 06/12/2025
- File Size 0.4MB
- # of Slides 2
- File Format PPTX
- Slide Ratio 16:9
- Color
Keywords
- #Content-Based Slides
- #Design-Based Slides
- #Product/Service Introduction
- #Market and Competitor Analysis
- #Diagram
- #Product and Service Overview
- #Customer Analysis
- #Spread
- #Centralized Diagram
- #16:9
- #radial diagram PowerPoint
- #infographic slide template
- #3-node visualization
- #music data presentation
- #how to create radial diagram in PowerPoint
About the Product
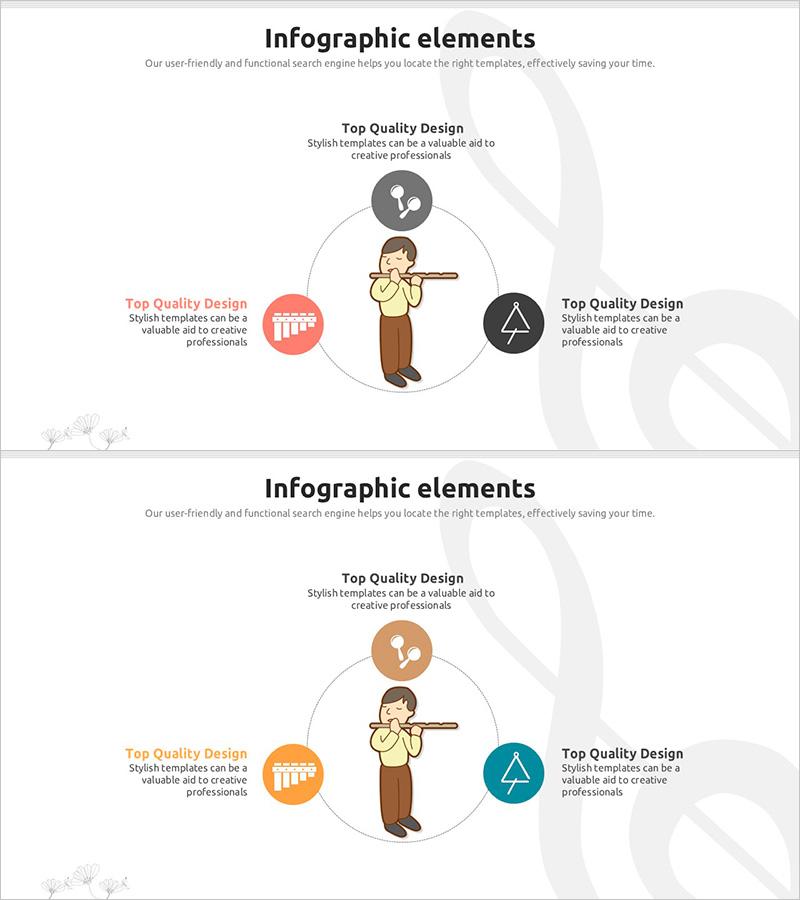
A radial infographic PowerPoint slide featuring a performer illustration at the center with three circular icon nodes positioned around it in a radial pattern. The design uses gray, pink, and black tones in one version and orange, teal, and dark blue in another, creating flexible color options for different presentation contexts. The 2-slide deck in 16:9 format effectively communicates relationships between music, instruments, customer analysis, and other key topics through a hub-and-spoke visual structure. Each node includes dedicated text areas for detailed information, making it ideal for data-driven presentations that require intuitive information hierarchy.
Usage Points
-
Main Usage
This radial infographic slide visualizes the relationship between a central concept and three surrounding elements. Perfect for music industry presentations, performance planning, customer segmentation analysis, and any scenario requiring hub-and-spoke information architecture.
-
How to Use
Replace the central performer illustration with your brand logo or key visual. Input analysis categories, product features, or customer segments into the three radial nodes. Select your preferred color version (gray-pink-black or orange-teal-blue), edit text and icons, and the slide is ready for immediate use in your presentation.
-
Recommended For
Music and performance planners, marketing professionals, market research analysts, and product presentation specialists. Ideal for business presentations involving customer analysis, market segmentation, value proposition communication, and multi-factor data visualization.
-
Slide Structure
2-slide deck with 16:9 aspect ratio. Each slide features a central performer illustration surrounded by three circular icon nodes positioned at top, left, and right. Text areas connect to each node for detailed information. Two color variations provided: gray-pink-black and orange-teal-blue versions for flexible branding alignment.
Related Products
-

Visualizing Customer Analysis with Touch Wide Diagram
#Market and Competitor Analysis #Marketing Plan and Strategy #Diagram
-

Customized Analysis Strategy by Audience Type – Secrets of Market-Driven Marketing
#Market and Competitor Analysis #Marketing Plan and Strategy #Diagram
-

Musician and Diffusion Diagram
#Product/Service Introduction #Business Introduction #Diagram
-

School Icons and Diffusion Diagrams – Highlighting Education and Creativity in Your Presentation
#Product/Service Introduction #Business Introduction #Diagram
