Fashion List and Side Table - Visualizing Product Features
RJ0500019_12
- Last Update 06/12/2025
- File Size 1.9MB
- # of Slides 2
- File Format PPTX
- Slide Ratio 16:9
- Color
Keywords
- #Content-Based Slides
- #Design-Based Slides
- #Product/Service Introduction
- #Diagram
- #Product/Service Introduction
- #Features
- #Cluster
- #Table
- #Combination Diagram
- #16:9
- #overlapping Venn diagram PowerPoint slide
- #3-circle comparison chart
- #product comparison template
- #fashion product analysis PPT
- #data visualization slide template
About the Product
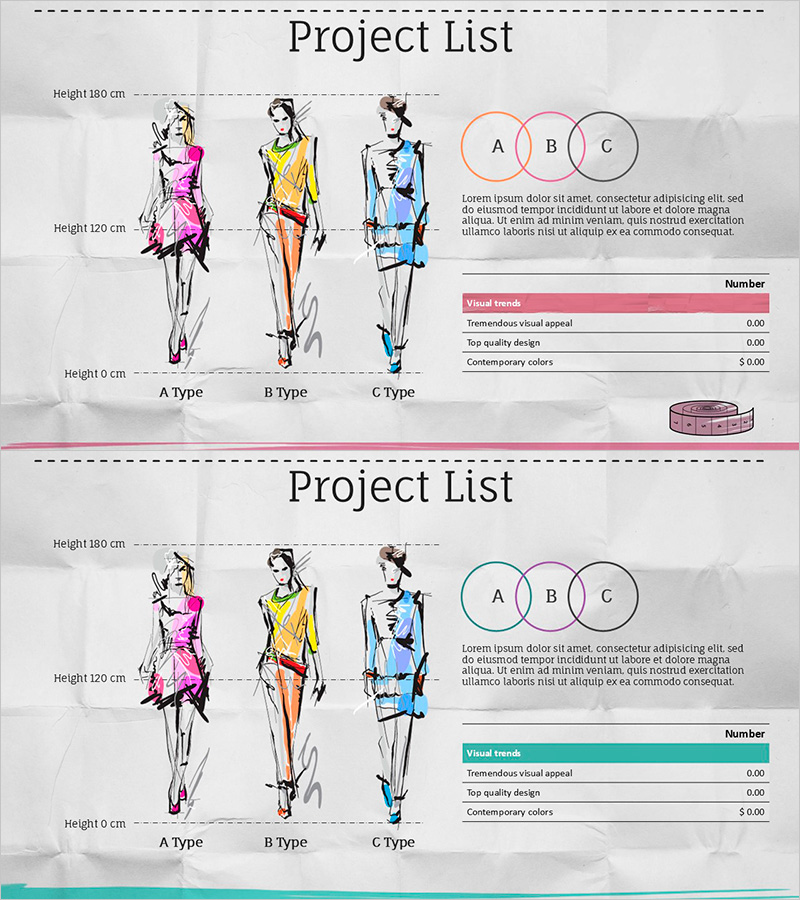
A professional overlapping Venn diagram PowerPoint slide designed to compare and analyze fashion product characteristics across three types. The slide features three intersecting circles in pink, yellow, and blue to distinguish A, B, and C type products, with a supporting data table on the right side displaying key metrics. The intersection areas highlight common features while distinct sections emphasize unique attributes. The 2-slide deck includes detailed specifications such as height, style, and price range, making it ideal for product presentations, market analysis, and competitive positioning in fashion and retail industries.
Usage Points
-
Main Usage
Visualize product or service characteristics across three distinct categories while emphasizing commonalities and differences through overlapping circle geometry. The intersection areas highlight shared features, while the supporting data table provides quantitative metrics for comprehensive product analysis and positioning.
-
How to Use
Ideal for fashion and apparel industry product line presentations, marketing strategy discussions, and competitive analysis reports. Slide 1 introduces the conceptual framework using the Venn diagram, while Slide 2 provides detailed numerical data in tabular format. Use the color-coded circles to represent different product types or market segments.
-
Recommended For
Product managers, marketing professionals, and sales teams in fashion, apparel, and retail sectors. Suitable for new product launch presentations, seasonal collection introductions, customer segmentation strategy meetings, and competitive positioning discussions with stakeholders.
-
Slide Structure
Slide 1: Three overlapping circles (A, B, C types) with intersection areas, color-coded legend (pink, yellow, blue), and descriptive text zones. Slide 2: Identical diagram layout with supplementary data table on the right (Visual trends, Tremendous visual appeal, Top quality design, Contemporary colors metrics). 16:9 widescreen format with balanced composition and clear visual hierarchy.
Related Products
-

Introduction to 3D Printer Product Features – Democratizing Innovation
#Product/Service Introduction #Diagram #Product/Service Introduction
-

Modern Business Presentation Template Circle Diagram – Product/Service Introduction
#Product/Service Introduction #Diagram #Product/Service Introduction
-

Iconic Business Value Presentation Slide Template
#Product/Service Introduction #Diagram #Features
-

Sofa Type Diagram – Product Introduction and Characteristics
#Product/Service Introduction #Diagram #Product/Service Introduction
