Introduction to 3D Printer Product Features – Democratizing Innovation
RJ0400036_7
- Last Update 05/27/2025
- File Size 0.8MB
- # of Slides 2
- File Format PPTX
- Slide Ratio 16:9
- Color
Keywords
- #Content-Based Slides
- #Design-Based Slides
- #Product/Service Introduction
- #Diagram
- #Product/Service Introduction
- #Features
- #Cluster
- #Table
- #Chain Diagram
- #Standard Table
- #16:9
- #3-node linear diagram PowerPoint
- #product features comparison slide
- #how to create diagram in PowerPoint
- #feature table slide template
- #business presentation diagram
About the Product
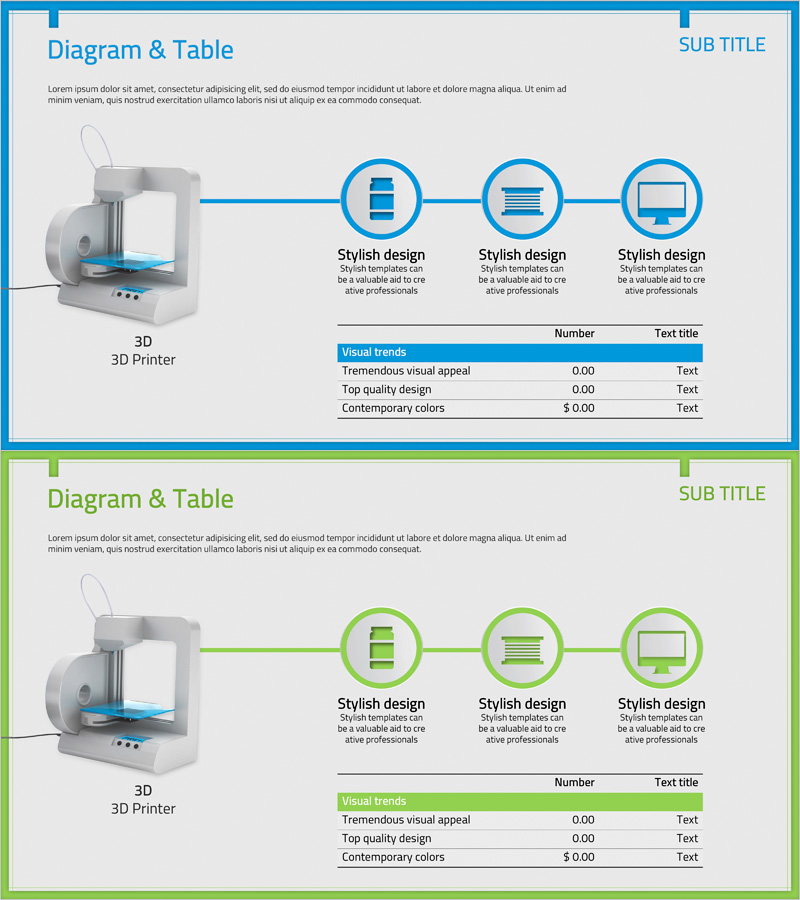
A 2-slide PowerPoint presentation set for introducing 3D printer product features. The first slide features a linear diagram with three circular nodes connected by blue lines, each node accompanied by an icon and descriptive text. The second slide presents an information table with a green header row, displaying visual trends, quality metrics, and color characteristics alongside numerical values. This structure is ready for immediate use in product presentations, business proposals, and feature-focused pitches.
Usage Points
-
Main Usage
Visualize product characteristics in sequential stages using a linear diagram, while organizing detailed information in a structured table format for clear audience communication. The three-node flow effectively represents product development stages, feature comparisons, or usage processes.
-
How to Use
Enter product feature names into the diagram nodes on the first slide, then populate the table on the second slide with specific metrics and descriptions. Maintain the blue and green color scheme or customize with your company brand colors to create a cohesive presentation.
-
Recommended For
Product marketing managers, sales presentation specialists, technology product presenters, and business strategists. Particularly suitable for product introductions in 3D printing, manufacturing, IT products, and innovation-focused industries.
-
Slide Structure
Slide 1: Linear diagram with 3 circular nodes connected by blue lines, text description areas below each node / Slide 2: Information table with green header row and 3 data rows, including visual trends, quality metrics, and color characteristics columns
Related Products
-

Legal Advice Area Diagram – Effective Flow Presentation
#Product/Service Introduction #Diagram #Product/Service Introduction
-

Geometry Pattern Wide Diagram – Product Introduction and Operational Plan
#Product/Service Introduction #Operational Plan #Diagram
-

Diagram Slide Explaining Structure and Function of Plants
#Product/Service Introduction #Diagram #Product/Service Introduction
-

Leaf Connection Diagram – Product/Service Introduction
#Product/Service Introduction #Diagram #Product/Service Introduction
