Semicircle Flow Project List
RJ0500017_4
- Last Update 06/11/2025
- File Size 2MB
- # of Slides 2
- File Format PPTX
- Slide Ratio 16:9
- Color
Keywords
About the Product
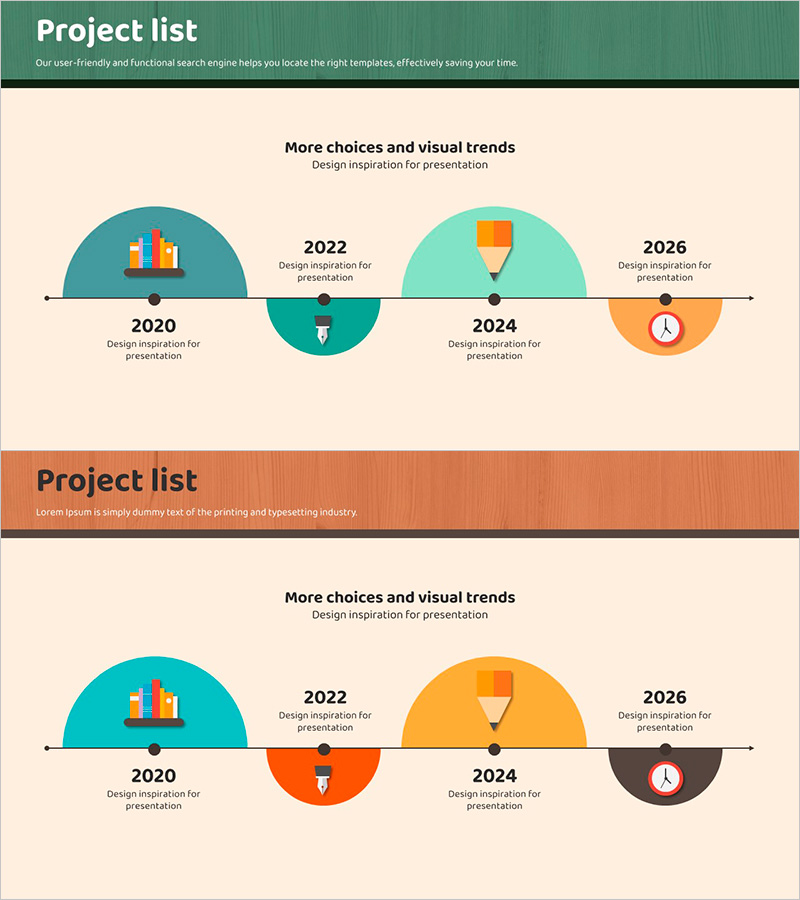
A linear flow diagram in semicircle shape that visualizes project progression stages in PowerPoint. This 2-slide set features a timeline format with 4 nodes arranged along a semicircular arc in teal, orange, and mint green tones on the first slide, and a 4-node structure in teal and orange on the second slide. Each node includes icons and text areas for clearly expressing project schedules, milestones, and stage-specific objectives. In 16:9 widescreen PPTX format, fully editable and ready to use in company introductions, business plans, project proposals, and various presentation materials.
Usage Points
-
Main Usage
Represents project timeline and stage-by-stage progress using a semicircular timeline format. Each stage features icons and text areas to clearly visualize milestones, objectives, and achievements, with diverse node colors in teal, orange, and mint green to distinguish each phase.
-
How to Use
Use in project proposals, business plans, and company introduction presentations to explain project schedules and progression stages. Edit node text and icons to input actual project phase names, dates, and responsible parties. Adjust node colors and positioning as needed for your specific requirements.
-
Recommended For
Ideal for project managers, planners, and marketing professionals presenting project status to executives or clients. Suitable for new business proposals, product development roadmaps, marketing campaign timelines, and any presentation explaining step-by-step processes.
-
Slide Structure
2-slide set. First slide displays a semicircular timeline with 4 nodes positioned along the arc, labeled with years (2020, 2022, 2024, 2026) and featuring icons (bar chart, lightbulb, clock, etc.). Second slide presents the same 4-stage structure with alternative color scheme (teal, orange, brown, orange).
Related Products
-

Water Resources History Presentation Template
#Company Introduction #Business Strategy #Diagram
-

History Text Diagram – Business Growth Story
#Company Introduction #Diagram #Text Box
-

Color Theme Presentation Template Diagram – Visualizing Business Management Flow
#Company Introduction #Business Management #Diagram
-

Green & Gray Template Wide History
#Company Introduction #Business Strategy #Diagram
