Business Process Diagram - Cluster and Connection
RJ0500011_19
- Last Update 06/10/2025
- File Size 4.1MB
- # of Slides 2
- File Format PPTX
- Slide Ratio 16:9
- Color
Keywords
- #Content-Based Slides
- #Design-Based Slides
- #Business Management
- #Technical Approach
- #Diagram
- #Execution Plan
- #Service Implementation Plan
- #Cluster
- #Chain Diagram
- #16:9
- #process diagram PowerPoint
- #4-step linear diagram
- #business process slide template
- #PowerPoint workflow diagram
- #connected diagram slide design
About the Product
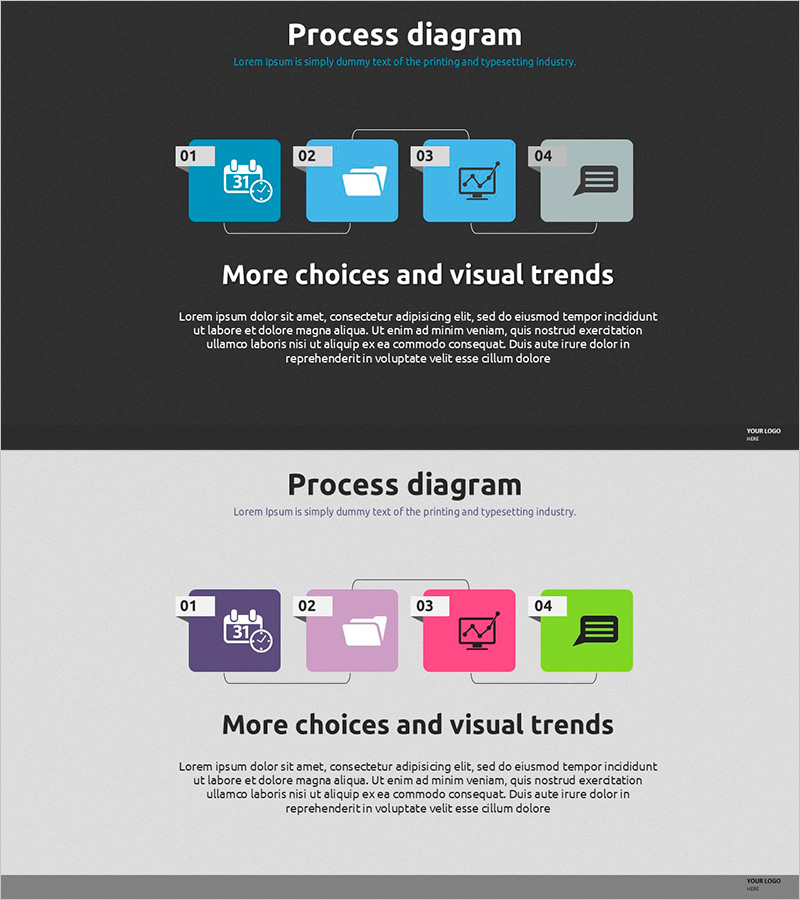
A linear process diagram PowerPoint slide that visualizes business workflows in four sequential steps. Each node features an icon and number label, connected by top and bottom connector lines to show relationships between stages. The design uses dark background with bright blue and gray tones for strong visual contrast and emphasis. Perfect for presentations on workflow processes, project phases, decision pathways, and system architecture. Includes two layout variations (dark and light backgrounds) in 16:9 widescreen format, with fully editable text and icon elements for immediate use in business presentations.
Usage Points
-
Main Usage
Designed to explain business processes, project phases, workflow sequences, decision paths, and system architectures across four sequential stages. The icon and text areas in each node enable clear communication of stage-specific information and key details.
-
How to Use
Replace the node numbers (01–04) and icons with content matching each stage, then add descriptive text in the designated areas. Adjust connector line styles or arrow directions as needed to reflect stage relationships. Select between dark or light color schemes to match your presentation's overall tone and branding.
-
Recommended For
Executive reports, strategic presentations, project kickoff meetings, process improvement proposals, employee onboarding materials, and consulting proposals where complex workflows need clear, simplified visual explanation.
-
Slide Structure
Two-slide set: Slide 1 features a dark background (charcoal/black) with four bright blue nodes and gray connector lines. Slide 2 uses a light background (light gray) with four multi-colored nodes (purple, pink, red, green). Each node includes separate icon and text input areas for easy customization.
Related Products
-

Healthy Food Campaign Execution Diagram
#Business Management #Technical Approach #Diagram
-

Suit Silhouette Diagram – Optimized for Business Strategy and Management
#Business Strategy #Business Management #Diagram
-

Construction Business Process Diagram – Visualize Effective Workflows
#Business Management #Operational Plan #Diagram
-

Step-by-Step Construction Execution Plan – Effective Business Management Strategy
#Business Strategy #Business Management #Diagram
