System Icon and Table Chart – Essential for Business Management
RJ0500011_15
- Last Update 06/10/2025
- File Size 4.1MB
- # of Slides 2
- File Format PPTX
- Slide Ratio 16:9
- Color
Keywords
About the Product
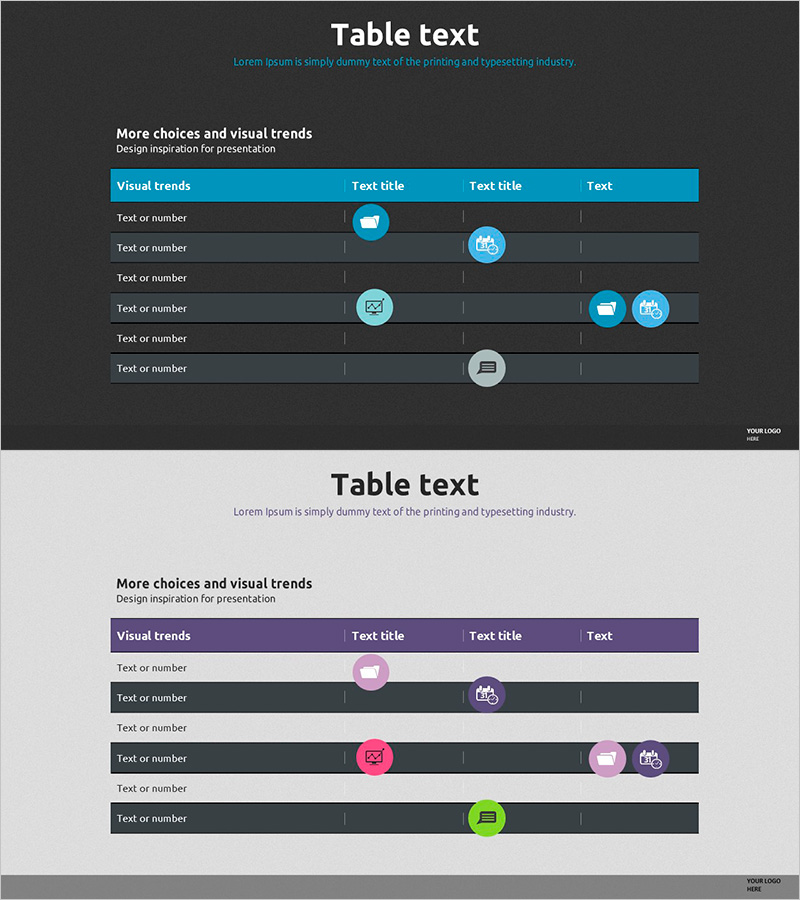
A system icon table PowerPoint slide designed to organize business management and project progress at a glance. Featuring two versions with dark and light backgrounds, this presentation slide includes a horizontal table structure with 6 column headers and 6 data entry rows. Each cell is populated with blue, green, and pink system icons (mail, people, chart, camera, chat) that intuitively represent category meanings. Text and numeric input is straightforward, making this slide deck immediately applicable to business reports, project plans, and performance analysis presentations.
Usage Points
-
Main Usage
Visualizes project progress, team role allocation, business performance metrics, marketing channel results, product feature comparison, and customer management items in a structured table format. System icons enable instant comprehension of each column's meaning, enhancing information delivery efficiency.
-
How to Use
Use the dark background version for evening presentations and online meetings; the light version suits printed materials and in-person presentations. Edit header text and cell content with actual data, and adjust icon colors as needed to emphasize categories.
-
Recommended For
Project managers, business analysts, marketing professionals, sales team leads, executive report coordinators, and consultants presenting quarterly reports, performance reviews, and strategic planning sessions.
-
Slide Structure
2-slide set. Each slide contains a horizontal table with 6 columns (Visual trends, Text title, Text title, Text, plus 2 additional columns) and 6 rows. Headers feature blue background; data rows alternate between dark gray and light gray. Blue, green, and pink system icons are positioned in each cell.
Related Products
-

Clear Slide for Christmas Eve Schedule
#Business Management #Diagram #Implementation Plan
-

Schedule Management Slide – Efficient Planning
#Business Strategy #Business Management #Diagram
-

Presentation Calendar – Two Versions
#Business Management #Operational Plan #Diagram
-

Schedule Template with Color Theme – Business Management and Action Plans
#Business Management #Diagram #Implementation Plan
