Triangle Flow Diagram – Visualization of Business Strategy
RJ0500011_12
- Last Update 06/10/2025
- File Size 4.1MB
- # of Slides 2
- File Format PPTX
- Slide Ratio 16:9
- Color
Keywords
About the Product
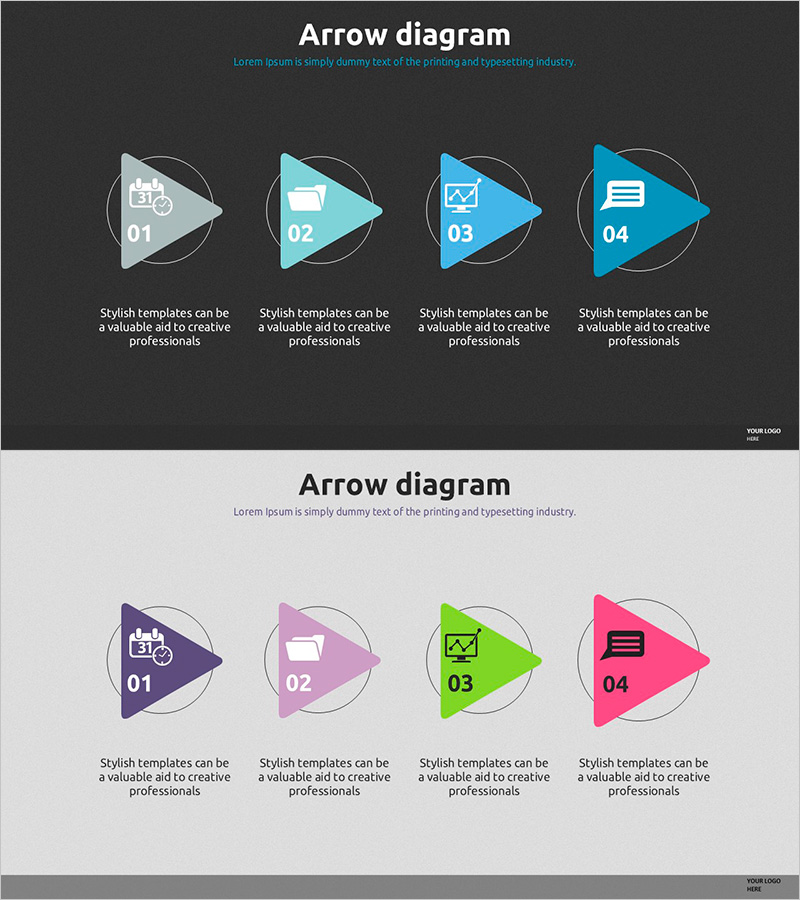
A 4-step arrow flow diagram PowerPoint slide designed to visualize business strategy progression and operational planning. Two versions are provided: dark background and light background, each with dedicated icon spaces and description text areas for every stage. The triangular arrow shapes intuitively represent step-by-step processes, and the slide is fully editable in PowerPoint. This presentation slide is ideal for business progress reports, process workflows, strategic execution phases, and various professional presentations.
Usage Points
-
Main Usage
This slide is optimized for visually communicating business progress and stage-by-stage strategy execution. The four sequential stages connected by arrows clearly represent process flow, with dedicated spaces for stage-specific icons and content. It effectively enhances credibility in presentations to investors, employees, and partners regarding business implementation plans.
-
How to Use
Insert relevant icons in each stage's icon area and fill in stage-specific objectives, activities, and outcomes in the text sections. Use the dark background version for sophisticated presentations and the light background version for positive, upbeat presentations. Colors and text can be freely customized to match your corporate brand guidelines.
-
Recommended For
Recommended for business plans, strategy presentations, operational planning reports, and project proposals where execution phases need clear explanation. Particularly effective for presentations to executives, investors, team members, and external partners when communicating business roadmaps. Applicable to marketing campaign phases, product development processes, organizational change management, and similar contexts.
-
Slide Structure
The slide consists of a title area and four identical stage blocks. Each block includes a number (01–04), icon input space, and description text area, with arrows representing sequential connection. Two versions are provided: dark background (charcoal and light blue tones) and light background (white and multicolor tones) for flexible presentation scenarios.
Related Products
-

Achievements and Stage Diagram – Visualizing Business Progress
#Business Strategy #Operational Plan #Diagram
-

Visualizing Logistics Transportation System – Strategic Operational Management
#Business Strategy #Operational Plan #Diagram
-

Performance and System Diagram for Business Strategies – Efficient Operation and Strategic Advancement
#Business Strategy #Operational Plan #Diagram
-

Technology Platform R&D Process Slide – 4-Step, Dark 2-Color
#Business Strategy #Operational Plan #Technical Approach
