Agricultural Product Production Planning Connection Diffusion Diagram
RJ0600073_6
- Last Update 07/09/2025
- File Size 4.2MB
- # of Slides 2
- File Format PPTX
- Slide Ratio 16:9
- Color
Keywords
- #Content-Based Slides
- #Design-Based Slides
- #Business Strategy
- #Operational Plan
- #Diagram
- #Production Plan
- #Production and Technology Development Strategy
- #Spread
- #Radial Diagram
- #16:9
- #radial diagram PowerPoint
- #diffusion diagram slide template
- #agricultural production planning presentation
- #3-node diagram
- #hierarchy structure PowerPoint slide
About the Product
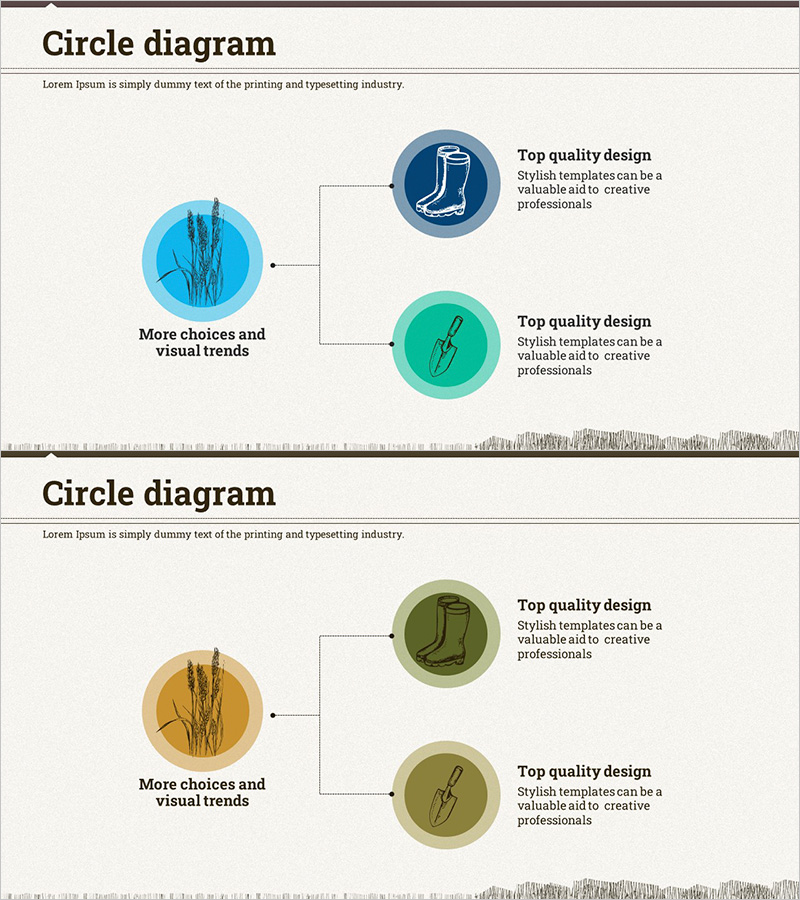
A radial diffusion diagram PowerPoint slide that expands from a central node to both sides, visualizing hierarchical information structures. Perfect for agricultural production planning, operational planning, and strategic initiatives. Features pastel-toned circular nodes in light blue, turquoise, yellow, and olive green with connecting lines that represent relationships between core concepts and detailed items. Each node includes icon and text description areas for customization. The 2-slide set provides color variations, making it ready to use in business presentations, planning documents, and reports.
Usage Points
-
Main Usage
Visualizes information hierarchies that expand from a core concept to detailed items. Effectively represents how agricultural production planning strategies branch into execution tasks, or how operational objectives cascade into departmental and phase-specific initiatives.
-
How to Use
Enter your core topic (e.g., Agricultural Production Planning) in the central light blue node. Add detailed items in the left turquoise and right olive green nodes. Customize icons to match your category and update text descriptions. Use the 2-slide color variations for different sections of your presentation.
-
Recommended For
Recommended for agricultural and food industry planning documents, production management reports, operational strategy presentations, and business plan strategy sections. Also suitable for marketing plan channel expansion strategies, organizational restructuring explanations, and project management task classification.
-
Slide Structure
Three-node structure with one central light blue circular node expanding to turquoise (left) and olive green (right) nodes. Each node contains an icon area and text input field. Dotted connector lines link the center to both side nodes. The 2-slide set maintains identical structure with different color palettes.
Related Products
-

Broccoli Cultivation Diagram – Efficient Production Planning
#Business Strategy #Operational Plan #Diagram
-

Spring Weather Text Box – Emphasizing Product Production Plans with Cluster Design
#Business Strategy #Operational Plan #Production Plan
-

Coffee Speaking Box – Capturing Business Strategy
#Business Strategy #Operational Plan #Diagram
-

Business Execution System Infographic – Strategic Operations Plan
#Business Strategy #Operational Plan #Diagram
