Table Survey Check Slide – Customer Feedback and Evaluation
RJ0500009_18
- Last Update 06/09/2025
- File Size 0.3MB
- # of Slides 2
- File Format PPTX
- Slide Ratio 16:9
- Color
Keywords
- #Content-Based Slides
- #Design-Based Slides
- #Business Management
- #Customer Success Stories
- #Diagram
- #Reporting and Review Plan
- #Customer Testimonials and Feedback
- #Table
- #16:9
- #table PPT slide
- #survey check PowerPoint
- #customer feedback table
- #comparison table slide
- #how to create a survey table in PowerPoint
About the Product
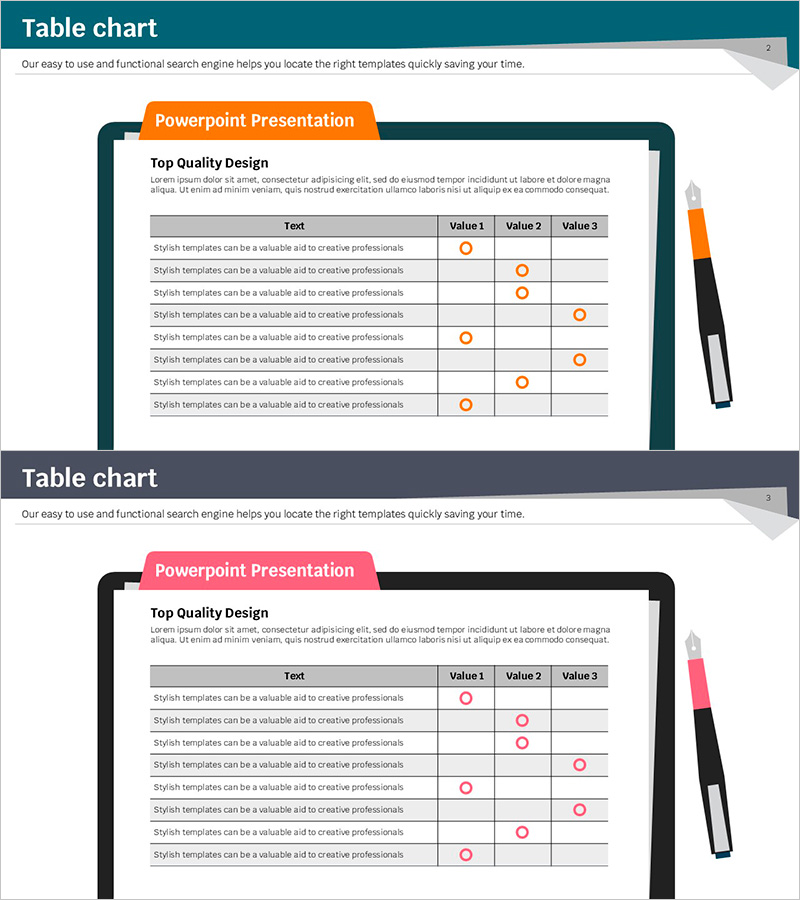
A table-format PowerPoint slide designed to organize customer feedback and evaluation results systematically. Features a three-column comparison layout (Value 1, 2, 3) with eight data rows, using circular check markers to visualize survey responses intuitively. Available in two color versions—orange and pink—making it immediately applicable for survey result analysis, customer satisfaction evaluation, business performance review, and stakeholder presentations. This editable PowerPoint slide set includes 2 slides in 16:9 widescreen format.
Usage Points
-
Main Usage
Visualize customer satisfaction surveys, evaluation scores, and comparative feedback data in table format to support clear decision-making. Ideal for quantitative data presentation in business performance reviews, product evaluations, and service quality assessments.
-
How to Use
Enter evaluation items in the 'Text' column of each row, then drag circular markers in Value 1, 2, 3 columns to indicate response results. Use the orange version for warm-toned presentations and pink version for brand-aligned corporate presentations. Table background colors and marker colors are fully customizable.
-
Recommended For
Marketing teams presenting customer satisfaction survey results, sales teams reporting client evaluations, executives reviewing business performance, quality assurance teams presenting product assessments, and consulting firms analyzing client feedback data.
-
Slide Structure
Two-slide set with each slide divided into a title area (top-left orange/pink banner) and table content area. The table comprises a header row (Text, Value 1, 2, 3) plus eight data rows with circular check markers positioned in each cell to display response distribution at a glance.
Related Products
-

Business Profit Analysis Results – Visualization of Market and Customer Feedback
#Market and Competitor Analysis #Customer Success Stories #Diagram
-

Simple PowerPoint Wide Template Evaluation Table - Easily Compare Data
#Market and Competitor Analysis #Customer Success Stories #Diagram
-

Table for Financial Planning Analysis – Customer Success Case
#Financial Plans and Performance #Customer Success Stories #Diagram
-

Total Analysis Results Table Chart – Insights into the Market
#Market and Competitor Analysis #Customer Success Stories #Diagram
